

Abstract
I discuss ways of measuring (change in) cycling levels and risk, with a case study of Hackney. The post compares the Census 2001 and 2011 commuter numbers with figures for cycling volumes/trips obtained via DfT counts/travel surveys (LATS/LTDS). To use the Census as a proxy for (change in) all-cycling volumes/trips within Hackney, I argue, produces an over-estimation and hence under-estimates (change in) risk. There are no perfect measures and more work needs doing, but, my analysis suggests cycling risk in Hackney was roughly similar in 2001 and 2015. I discuss reasons why the Census does not work well here for this purpose, and conclude that Hackney Council should develop, share and regularly monitor a rate-based means of monitoring cycle casualties within the borough, in line with its Transport Strategy pledge; as should organisations in other areas.
Introduction
In November 2015, when Hackney Council adopted its Transport Strategy (incorporating the Cycling Plan), one of the promised actions was to ‘Develop and Adopt a Rate-Based Means of Monitoring Pedal Cyclist Casualty Levels on Borough Roads’.
When I spoke to the Hackney Cycling Campaign meeting at the start of this month, I outlined a rough approach to calculating such a rate, looking just at 2005-15. The rate I presented to the meeting is based on pedal cycle counts from all DfT count sites in Hackney – over 60 locations annually:
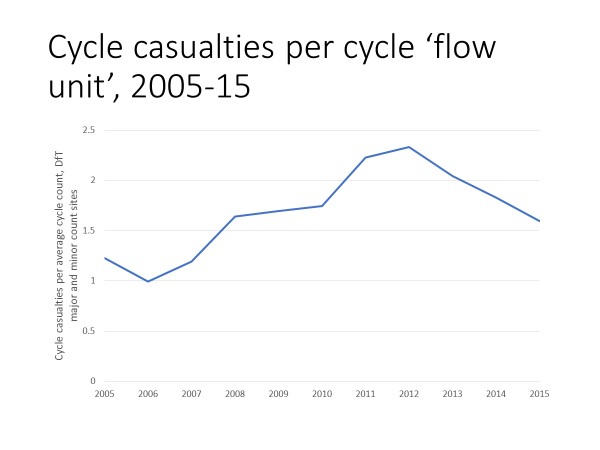
The slide on cycling injury risk, from the Hackney Cyclists meeting
NB I’ve taken ‘borough roads’ to include all roads in the borough, for practical and policy/political reasons. Firstly, if you only look at roads that Hackney Council as opposed to TfL runs, you cut down the injury sample and make measuring changes in exposure (i.e. cycling) very difficult. Secondly, because I believe Hackney should be monitoring changes on all roads within its boundaries, to provide an evidence base to support the case for improvements on TfL roads like the A10 where so many injuries happen (as well as to support improvements to its own roads).
Comparing data sources
Since then, I’ve done some further calculations – sparked by a response to the press release accompanying my talk. This took the form of a blog post by a Hackney councillor, Vincent Stops, arguing that there is no reliable data for monitoring cycling levels in the borough aside from the 2001 and 2011 Census, and that this data can be treated as a proxy for the amount of cycling in the borough – hence, this more than tripled during the period.
I disagree. I think that there are other useful sources of data, but also that the Census is problematic used for such purposes, particularly in a dense Inner London borough. On the latter point, I’ll provide data supporting my case, and then later discuss what the reasons might be.
I think DfT count data (with other data; see below) is a useful part of the picture in assessing changes in risk. Count data has the virtue of directly measuring numbers of cyclists on the roads (rather than reported behaviour), and even if count data doesn’t provide an accurate measure for a single year, I think given comparable counting methods and a reasonable spread of locations, a rate of change can be estimated.
It’s true that most (not all!) DfT count sites are A roads, so it is indeed possible that this doesn’t well reflect changes in cycling volumes in Hackney, if cycling uptake grew faster on minor roads than on the A roads. Ideally, then, one would combine the DfT data with more counts on minor roads conducted by TfL or Hackney Council, if such could be made available (with some calibration as they might count cycles differently to the DfT).
This graph plots my DfT count-derived measure (being an average of pedal cycle counts recorded across all DfT sites in Hackney, per year) against the two Census data points (for both, 2001=1):
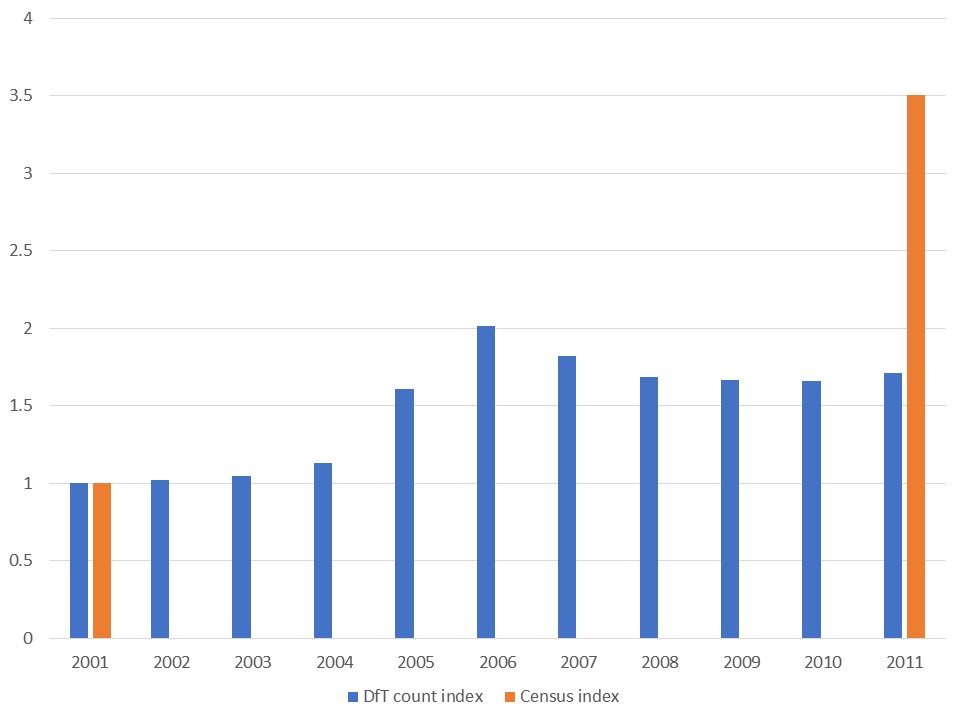
While the Census data suggests a more-than-tripling, the cycle counts show a less-than-doubling.
Which is right? Neither is perfect, and they are both capturing different things – so really, it’s which is better for our particular purpose here: estimating cycling volumes.
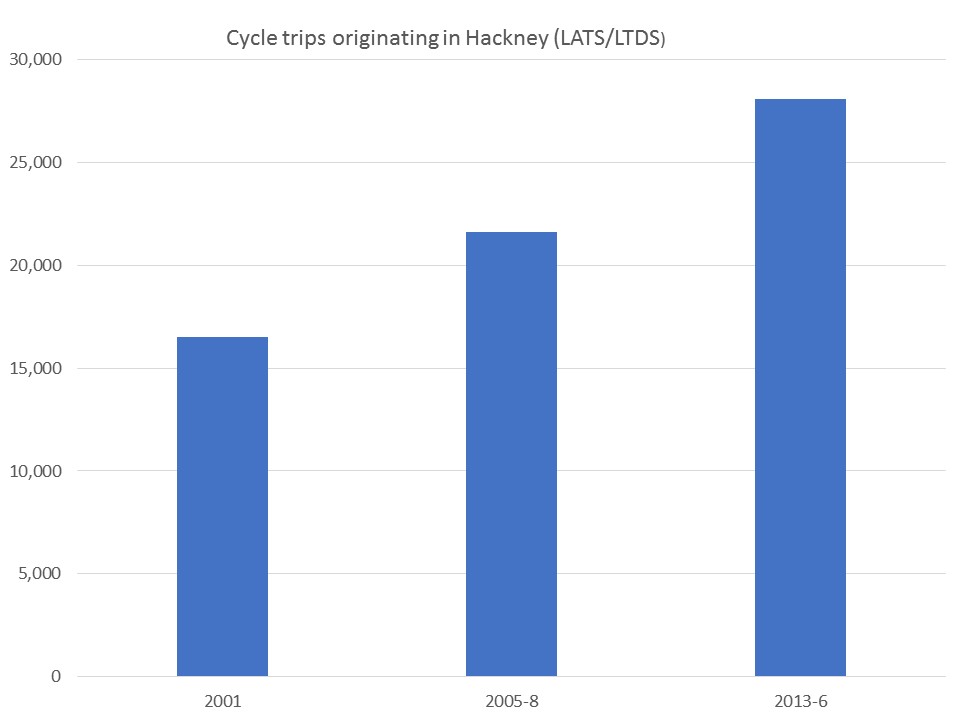
I decided to have a closer look at London Travel Demand Survey results (LTDS, conducted from 2005) and its predecessor, LATS (London Area Transport Survey – conducted less frequently and last in 2001). LTDS sample sizes are small (500-600) for each borough in a year, so TfL reports three-yearly figures and suggests only comparing completed three-year periods (not overlapping periods). I took Hackney figures for the earliest (2005-08) and latest (2013-6) periods, using ‘borough of trip origin’ rates rather than ‘resident trips’: the former being likely to be a better approximation of (change in) volume on the borough’s streets.
The mode share for 2005-08 can be found in Travel in London 1. It gives trips starting in Hackney as having 6% cycling mode share. So does the latest figure, found in TfL’s current Local Implementation Plan monitoring report.

The number of trips starting in Hackney has increased between those two periods, though, so while mode share hasn’t changed the absolute number of cycle trips will have done. In 2005-08, there were on average 360,000 daily trips starting in the borough, while in 2013-6, the figure rose to 468,000.
This means that between 2005-08 and 2013-16 the number of daily cycle trips starting in Hackney rose from 21,600 to 28,080 – a growth of 30% over eight years.
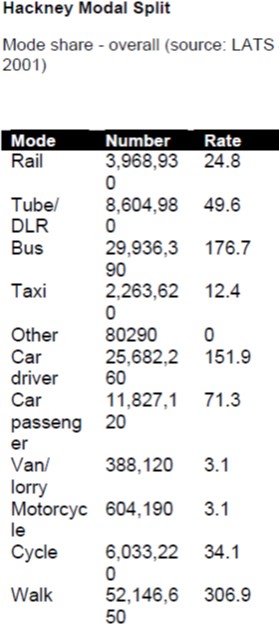
But what about 2001? This would allow us to better compare the Census period. I found a figure from LATS 2001 in a 2006-11 Local Implementation Plan produced by Hackney.
While this is just one year’s data, the LATS sample size was over twice as large as that of LTDS. The table is a bit difficult to read, but seems to give annual trips rather than daily trips, which I divided to give a daily figure for both all trips and cycling. The cycling figure equates to a plausible (and impressive in the London 2001 context) 4.3% of Hackney originating trips cycled in 2001 – 16,529 trips daily.
2011 is mid-way between 2005-8 and 2013-6, so assuming around half the trip growth had happened by then, there might have been 25,650 trips that year starting in Hackney. Therefore, the rise in cycling suggested by LTDS/LATS between 2001-11 is around 55% – actually not far off the 71% growth indicated by the DfT count figure. (And suggesting it’s maybe even possible that the rise of cycling on A roads has been somewhat greater than the rise across minor roads – which is possible, if the A roads are more direct.)
The graph below shows the DfT count figures plotted against the LATS/LTDS figures, and against the cycling injury figures.
For LATS/LTDS, I’ve assumed that growth trends were linear between 2001 and 2005-08, and between 2005-08 and 2013-6 (both gradients are similar, in fact). For all three, I’ve taken the figure in 2001 as normalised to ‘1’, with later figures relative to this.
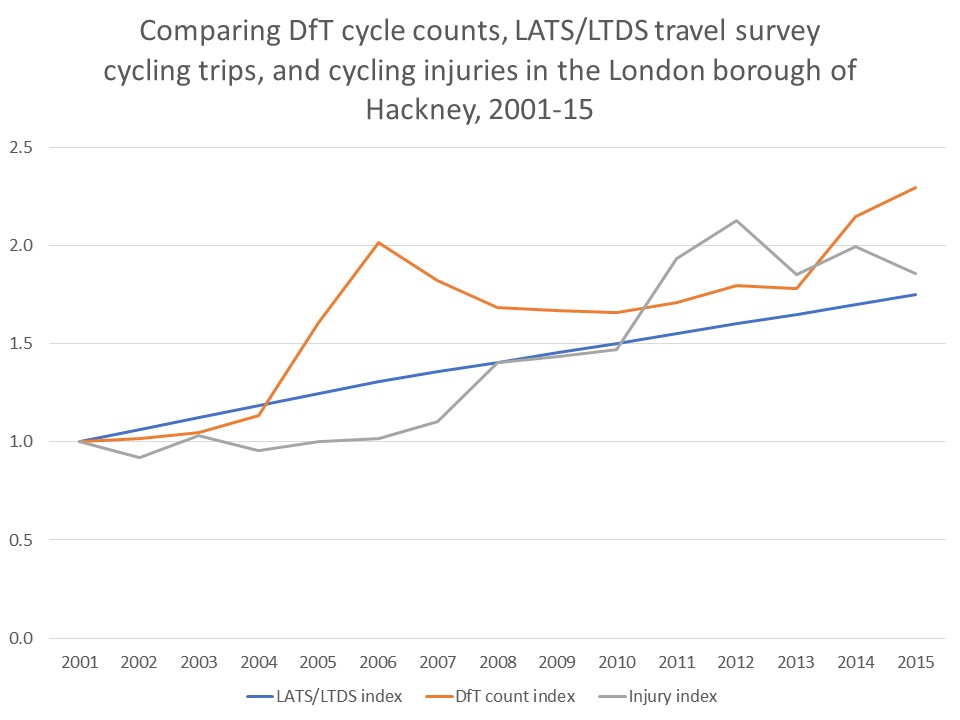
The chart suggests that cycling risk in Hackney was not so different in 2001 and 2015. I hope policy-makers in Hackney think about this chart – as well as developing ideas for improving the measurement, for instance one could use LATS/LTDS raw data, draw in additional count data, etc. (I have ideas, and would be happy to discuss them, but lacked time to do a really detailed analysis). And beyond Hackney – because across London and the UK we should be doing better in monitoring and reducing cycling risk.
Why we might expect the Census growth to overestimate growth in cycle trips or volumes
But still, you might very reasonably ask… Why does the Census give such different results to count and travel survey data? Surely it is good data? It doesn’t have much in the way of sampling issues, unlike the other two sources.
The Census is great, and I’ve used it in projects and papers. At national or regional level, it’s a good proxy for levels of all cycling. Because it’s got nearly everyone and is available to small geographies for stated commute origins and destinations, it’s fantastic for projects like the PCT that need flow data.
But to repeat, I don’t think it’s a good proxy for change in volumes of cycling on Hackney’s roads. The DfT count and LTDS/LATS results support this, but there’s also good underlying explanations (although the first few will affect larger urban areas, and are not so relevant to more self-contained local authorities).
A change in the number of Hackney residents saying they cycle to work does not necessarily mean an equivalent change in commute trips, nor in the volume of cycle commuters on Hackney’s roads. (They are three different things, in fact).
The Census asks people about usual main mode of travel to work. ‘What do you usually do’ type questions are prone to social desirability bias (positive or negative).
This wouldn’t necessarily matter for change in an area, unless the social desirability of the behaviour has substantially changed between survey periods. If so – and arguably that’s the case in Hackney between 2001 and 2011, in relation to cycling – it may skew the results, particularly here where people are multi-modal hence can easily persuade themselves they ‘normally’ cycle.
A related point here: people taking up cycling in a context where it’s more normalised may really be more multi-modal than cyclists in a less normalised context, less likely to be die-hard riders who’ll cycle in through the snow and the fog. (They’re being asked in May about their usual behaviour).
Moreover though, cycle commuter volumes on Hackney’s route network do not only result from changes in Hackney’s own cycle commuting rates. Some people ride from different boroughs – and using PCT lines data I found around a quarter of current crow-fly commuter distance cycled on Hackney’s roads neither starts nor ends in Hackney. A substantial minority of people who use Hackney’s roads are riding for instance from Newham to the City, or from Waltham Forest to Camden. Cycle commuting rates in those boroughs of origin haven’t been increasing at anything near the Hackney rate – so if we treat the changing Hackney rate as a reliable proxy for changing volumes, we’ll again over-estimate the increase in the volumes of cycle commuters riding through Hackney.
These aren’t my main reasons for querying the idea that a change in the numbers of ‘Census cycle commuters’ is a good proxy for changes in volumes of overall cycling on Hackney’s roads, though.
This idea depends upon the assumption that just as Hackney’s reported cycle commuting rates more than doubled, so did rates of cycling for all other trips.
But cycle commuting represents less than 20% of trips or distance. So changes in cycling rates/volumes is generally driven largely by changes in cycling for other types of trip. (Making it unfortunate that we so often focus on the commute; for understandable reasons including data availability, of course).
Take an example. A local authority with a cycling mode share (overall) of 5%, let’s say. The 5% is the same across commute and non-commute trips (as would be the case in the Netherlands). The local authority doubles the modal share of cycle commuting to 10% of commute trips; but doesn’t manage to increase the modal share of other trips. Therefore, its overall mode share only rises from 5% to 6% (taking commutes as being 20% of all trips).
Could this skewing (albeit not so extreme) have happened in Hackney? The LTDS and DfT count figures suggest it may have done, and that during 2001-11 even if cycle commuting trips did increase threefold, non-commute cycle trips have grown at a slower rate, leading to a smaller overall rise in overall cycle trips and in cycling volumes on the route network.
Comparing the LTDS and Census figures, the proportion of cycle trips made for commuting purposes may have roughly doubled between 2001-11. (They’re not quite comparable; as the LTDS figures relate to trips starting in Hackney, not to residents’ mode share – but it gives an idea).
Conclusions from this post? It is possible to monitor changes in cycling risk, triangulating different data sources and remaining aware of the limitations of each. Hackney and other authorities can develop indicators to use for this, and I hope they do. It’s not good enough either just to rely on/wait for the Census (for the reasons I suggest above) or to deny that we have enough data to estimate and monitor changes in risk – as opposed to absolute injury numbers.
Lets hope the numbers keep dropping hey Rachel 🙂