

This is a response to the Transport Select Committee on Road Safety: I’ll submit it tomorrow. Although the deadline has passed, they are still accepting submissions.
I am a Reader at the University of Westminster who specialises in active travel. I have published many peer-reviewed papers on issues including road safety, and I am currently running an 18-month project on cycling injury risk funded by the Road Safety Trust. In this brief response I will highlight some headline themes related particularly to walking and cycling, but I am happy to provide further information and/or speak to the Committee in person, if wished. As much of my response relates to the need to re-frame road safety debates, I begin by briefly outlining relevant context, which is however not widely known.
Context:
- Walking and cycling are several times riskier than in some other European countries
- The injury risk gap for people walking or cycling, compared to car users, has widened
- Motor vehicles represent the main threat to people walking and cycling
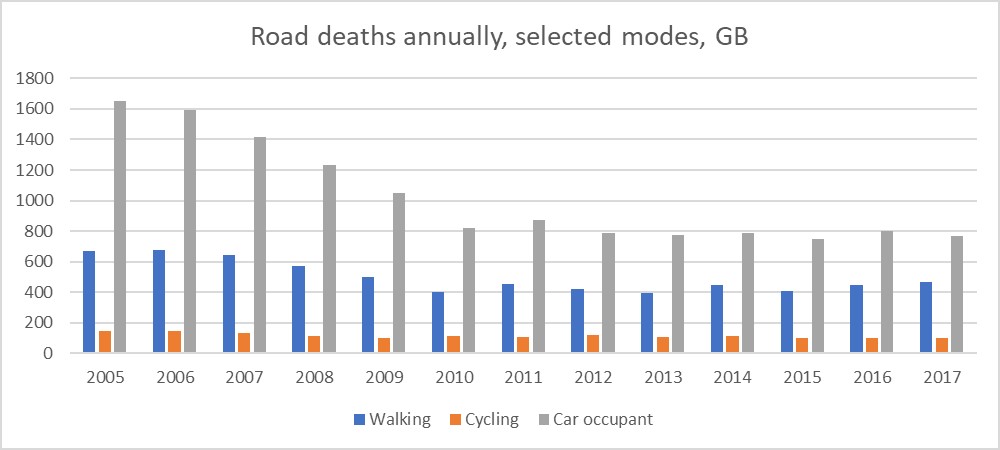
Figure 1: road deaths by year, selected modes (source: Stats19)
As noted by the Committee, decline in road deaths has halted since 2009-10. Figure 1 contrasts changes between 2005-17 for pedestrians, cyclists, and car occupants. By 2017, deaths of car occupants had declined by 55% compared to 2005 (most of the change happening between 2005 and 2010). However, for people walking or cycling, the reduction was less: 30% and 32% respectively. Only around half this gap is accounted for by changes in distance travelled for different modes. DfT Table RAS53001[i] which normalises for distance travelled between 2005-15 finds that risk per km travelled for car users declined by 54%, but for people walking or cycling by 37% and 41% respectively.
So not only has there been a levelling off, but the prior decline in risk benefitted people walking and cycling less than car occupants. If we examine rates of change in the most serious injuries (‘KSIs’) and use Census data for exposure, between 2001-2011 risk per commuter fell by 49% for motorists but grew by 4% for people cycling[ii]. People cycling are now 5-6% of road deaths, and 10-11% of injuries, despite only making up 1% of distance travelled. People on foot, with 3% of travel distance, are 25-26% of fatalities, and 11-12% of injuries.
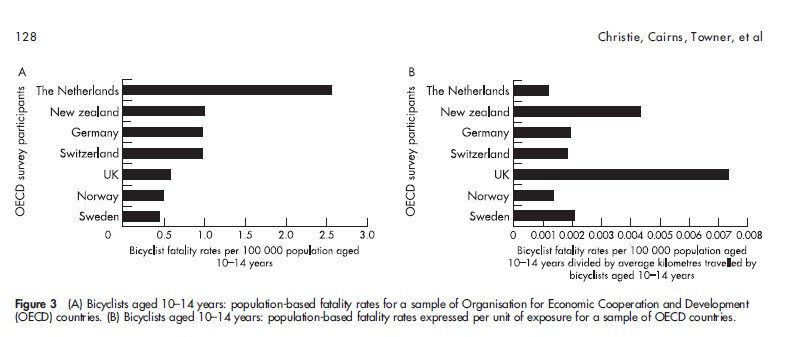
Figure 2: Comparing risk fairly across countries – use the right-hand graph to control for exposure. Source: Christie et al 2007
When we compare our current performance to other European countries, we are far from the best, although not the worst. How we measure matters. There is no point comparing our cycling fatality figures per head of population with those of the Netherlands or Denmark, because cycling rates are so much higher in those countries. An article by Christie et al[iii] shows how a population-based metric hides the relatively high fatality risk experienced by 10-14-year olds who cycle in the UK, which is notably worse than the risk experienced by children cycling in the Netherlands, Switzerland, Germany, Norway, Sweden, and New Zealand (Figure 2).
A more recent, pan-European comparison (per person, per km) by Castro et al[iv] found people who cycle in the UK are 2.6 times more likely to die per km travelled, and pedestrians 2.3 times more likely to die, compared to the Netherlands. If our roads were as safe as Dutch roads for those walking and cycling, 266 pedestrians and 62 cyclists would not have died on our roads in 2017. Note that in practice, the road safety gap for cycling is even wider, because the Dutch cycling demographic contains many older people who are more vulnerable to severe injury in a collision or fall, whereas cycling in the UK is skewed to younger adults[v].
Finally, the ‘road safety’ problem for people walking or cycling is fundamentally about motor vehicles. ‘Research worldwide consistently finds that the higher the traffic volume, the greater the frequency of pedestrian injuries’[vi]. Similarly, for people cycling, the higher the volume of motor traffic with which they must share space, the higher the risk of injury[vii]. Of people killed cycling on the roads between 2005 and 2017, 88% died in incidents involving a motor vehicle. For pedestrians the figure is 99%, although these two figures are not comparable as unlike cyclist falls, pedestrian falls are not included in police injury data[viii]. Thus, the pedestrian figure tells us that few pedestrian fatalities stem from a pedestrian-cyclist collision (or a collision with another non-motorised user e.g. horse). Even for less severe injury incidents, such as those self-reported by National Travel Survey participants, motor vehicle collisions are the major cause of injury for people walking or cycling, followed by falls (pedestrian-cyclist collisions come far behind, for both groups)[ix].
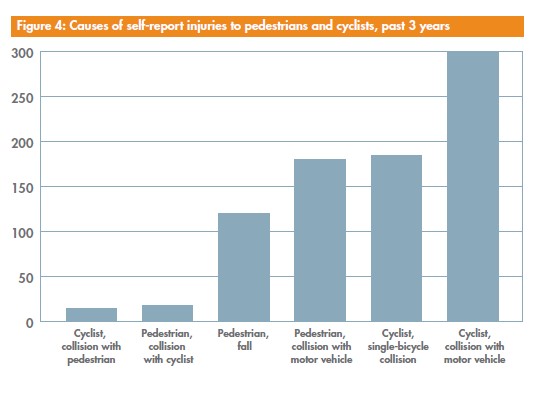
Figure 3: Comparison of numbers of injuries in different types of incident, National Travel Survey data (Aldred 2018)
Response
My key response points stem from the context above. ‘Business as usual’ approaches seem to have stopped working, and even when they did work, the reductions in injury risk that we achieved have benefitted people walking or cycling less than people in cars. This year, we will again see several hundred people die while walking or cycling on our roads, who instead could still be alive if our roads were as safe here for walking and cycling as they are in the best performing European countries. Not only is this morally unjust, it counteracts our attempts to get more people walking and cycling, and to cut unnecessary car trips.
A shift in approach is needed, with four key components, which all help re-frame the policy debate and which lead on to specific policy ideas, which due to space constraints can only be signposted here:
1. Vision Zero/Safe Systems. Road injuries are often triggered by someone making a mistake – whether the victim or another road user. While we need to reduce careless and dangerous driving behaviour (see below) we also need to change road environments such that mistakes do not lead to death or serious injury, many of which could be prevented[x]. There are many ways in which risk has been designed-in to our road network. For instance, we allow large HGVs with multiple ‘blind spots’ into city centres despite the high risk they pose[xi]; we have a default urban speed limit of 30mph despite higher motor traffic speeds being associated with higher pedestrian injury risk[xii]; and our typical junction designs build in ‘left hooks’ by not separating people cycling from conflicting motor traffic flows[xiii]. These and other factors are choices that can be changed, if we are serious about reducing unnecessary deaths among people walking and cycling.
2. Move from a reactive, to a pro-active approach to injury prevention. At present, ‘road safety’ too often means waiting for one or more deaths to change a crossing that is believed to be dangerous. We do not take account of evidence of problems, when we could do more to collect data and act on it. Regular UK cyclists may experience one ‘very scary’ near miss incident on a weekly basis[xiv], and such incidents may tell us about where injury collisions might happen if this is not prevented. We do not take a reactive approach to air or rail safety.
But we do not need to wait for near miss data to be pro-active on road safety. Research confirms the kind of changes that are needed to road infrastructure for keep people walking and cycling safe[xv]. Fundamentally, these are based around protecting pedestrians and cyclists from motor vehicles, by (a) reducing the numbers of interactions with motor vehicles (providing protected space for those walking or cycling; or in locations with sharing, reducing the number of motor vehicles), and (b) reducing the risk posed by those interactions that remain (by making vehicles safer, reducing speeds, etc.) Specifically, research suggests building separated infrastructure for people cycling could reduce injury odds as much as nine-fold on busy roads with car parking[xvi]. My own recent study in London found reductions in cycling injury risk associated with 20mph zones and streets with very low levels of motor traffic, highlighting the safety potential of measures that reduce motor traffic speeds and volumes in neighbourhoods[xvii]. While more data is always useful, the evidence base is there to implement infrastructure changes that protect people walking and cycling, before deaths happen.
3. Road Danger Reduction. A road danger reduction approach (adopted by Transport for London[xviii]) complements Vision Zero by targeting the most dangerous road users, rather than the victims. It involves measuring and seeking to reduce risk posed to others. A paper I am working on suggests that on urban minor roads, HGVs are associated with 8-10 times more third-party fatalities per km than cars, vans, or taxis, and 30 times more third-party fatalities per km than bicycles[xix]. There are further interesting variations in mode-specific risk posed by age and gender. Such data should be part of the mix when we discuss road safety, but usually is not. Part of the problem, as TfL have identified, is that those responsible for dangerous vehicles (e.g. construction firms) do not ‘own’ that responsibility. Instead, a pervasive public discourse blames pedestrians or cyclists for injury collisions and minimises driver culpability[xx]. This is despite evidence of widespread law-breaking by people when they drive. Around half of car drivers exceed speed limits on motorways and on 30mph roads[xxi]. A recent study found that 1–2% of drivers overtaking a person on a bicycle came within 50 cm, behaviour that carries a high risk of injury for the rider, given the slightest misjudgement on either’s part (or if the rider wobbles over a pothole, for instance).
Policy should avoid contributing to this failure to correctly locate responsibility (for instance, the word ‘accident’ is problematic), and further, should actively seek to challenge it. A study by TRL found that for cycle-motor vehicle collisions where an adult cyclist is injured, the police are more likely to attribute ‘contributory factors’ to the motorist[xxii], who is however unlikely to have been injured themselves in the collision. This illustrates the imbalance between risk and consequences, which needs to be challenged by ensuring that use of motor vehicles is not seen as a right; but as a dangerous activity which entails a duty of care to others, a privilege that can be revoked. For instance, rather than only increasing prison penalties for offences with more serious consequences, we should also do more to remove driving licences from unsafe drivers before they kill someone.
4. Linking Safety to Health. While road danger is primarily created by use of motorised vehicles, walking and cycling in themselves are safe and healthy. Although injury risk and severity rise as people get older, the health benefits of walking and cycling grow faster, due to the benefits of physical activity[xxiii]. It is important in our metrics to build in support for more walking and cycling. For walking and cycling, we should benchmark injury risk rates against safer countries, such as the Netherlands and Norway, and not see a decline in injuries as a ‘good thing’ if it is due to less walking or cycling.
[i] https://www.gov.uk/government/statistical-data-sets/ras53-modal-comparisons
[ii] https://injuryprevention.bmj.com/content/early/2018/06/23/injuryprev-2017-042498.abstract
[iii] https://www.researchgate.net/publication/6383065_How_exposure_information_can_enhance_our_understanding_of_child_traffic_death_leagues
[iv] https://www.itf-oecd.org/sites/default/files/docs/exposure-adjusted-road-fatality-rates-cycling-walking-europe.pdf
[v] https://journals.plos.org/plosone/article?id=10.1371/journal.pone.0050606
[vi] https://journals.sagepub.com/doi/full/10.1177/0885412215595438
[vii] https://www.sciencedirect.com/science/article/pii/S0001457518301076
[viii] We should also be collecting data on pedestrian falls, many of which may be preventable, for instance by improving footway condition, removing footway obstacles, etc.
[ix] http://rachelaldred.org/wp-content/uploads/2019/03/Road_Injuries_Report.pdf and https://www.sciencedirect.com/science/article/pii/S2214140517306308
[x] https://dspace.lboro.ac.uk/dspace-jspui/bitstream/2134/16487/1/AR2657+Pedal+cyclist+fatalities+in+london.pdf
[xi] https://bmcpublichealth.biomedcentral.com/articles/10.1186/1471-2458-10-699
[xii] https://journals.sagepub.com/doi/full/10.1177/0885412215595438
[xiii] https://dspace.lboro.ac.uk/dspace-jspui/bitstream/2134/16487/1/AR2657+Pedal+cyclist+fatalities+in+london.pdf
[xiv] https://www.sciencedirect.com/science/article/pii/S2214140515002236
[xv] E.g. for pedestrians, https://journals.sagepub.com/doi/full/10.1177/0885412215595438
[xvi] https://ajph.aphapublications.org/doi/full/10.2105/AJPH.2012.300762
[xvii] https://www.sciencedirect.com/science/article/pii/S0001457518301076
[xviii] http://content.tfl.gov.uk/vision-zero-action-plan.pdf, which contains many useful policy suggestions.
[xix] Currently unpublished but happy to discuss further on request.
[xx] https://journals.sagepub.com/doi/full/10.1177/0361198119825637 – study is from the US but similar patterns can be found here.
[xxi] https://assets.publishing.service.gov.uk/government/uploads/system/uploads/attachment_data/file/743878/vehicle-speed-compliance-statistics-2017.pdf
Very interesting reading.
Another factor which will increasingly come into decision making on whether to walk,cycle, bus or car will be the dangerous toxic fumes that are inhaled. With increasing prevalence of non smoking related lung cancers this is now a major factor. I cycle about 6000 miles a year. Suffer from unintentional close shaves and deliberate close shaves on a daily basis. But I am now increasingly concerned about the fumes I’m inhaling.
Changing the traffic light system to let cyclists go off first would help. Also public awareness campaigns to improve poor driving which will then have a knock affect of increasing cycling as a form of travel
Did you see this – very interesting:
https://www.bbc.co.uk/news/av/uk-england-south-yorkshire-49960950/how-do-you-breathe-less-pollution-on-school-run
Absolutely Fascinating !!
especially Fig 3 B Shows how bad UK is cf other countries.
I would say THE biggest, simplest, low cost (almost silver bullet) to this problem would be to adopt ‘presumed liability’ even before infra improvements. (I work in NL where cycling is just ‘normal’)
This would help, not only in the bike vs car situation which is tangibly dangerous, but also the ped vs bike , which I believe gives a huge -ve image of cycling to the majority of the UK population (peds) who see ‘them’ as speed freaks/ boy racers on shared paths. https://issuu.com/mark77a/docs/blue_ocean_chronicles_-_a_trilogy_-_cycling_for_al