

Summary: we are sharing a pre-print of analysis specifically looking at LTNs within Outer London’s mini-Holland schemes. Although the ‘LTN area’ sample size is small (most intervention areas weren’t LTNs) and uncertainty about effect sizes is large, we find consistent evidence about their direction. LTNs have reduced residents’ car ownership and/or use, and the already demonstrated increase in active travel from mini-Holland schemes is higher in LTNs.
Low Traffic Neighbourhoods have become a hot topic across the UK, especially in London. They form part of a series of relatively cheap and quick streetscape changes, which are being encouraged and/or funded by government as emergency measures to provide safer walking and cycling environments (safer from Covid-19 and from traffic injury risk) and relatedly, to try and discourage growth in car use given that public transport is still operating with major capacity restrictions. (See here and here for more).
What is a ‘Low Traffic Neighbourhood’? It’s a neighbourhood in which most or all through motor traffic has been removed from local residential streets (‘filtered’). This can be done in a range of ways: by planters, bollards, or other street furniture that physically block the road (emergency services can have key access to lockable bollards), by camera-enforced ‘gates’ (without physical restrictions, often so buses may get through, but fines may be imposed for illegitimate use), or opposed short sections of one-way street with cycle contraflows, intended to have a similar effect (less popular now, but some older schemes exist).
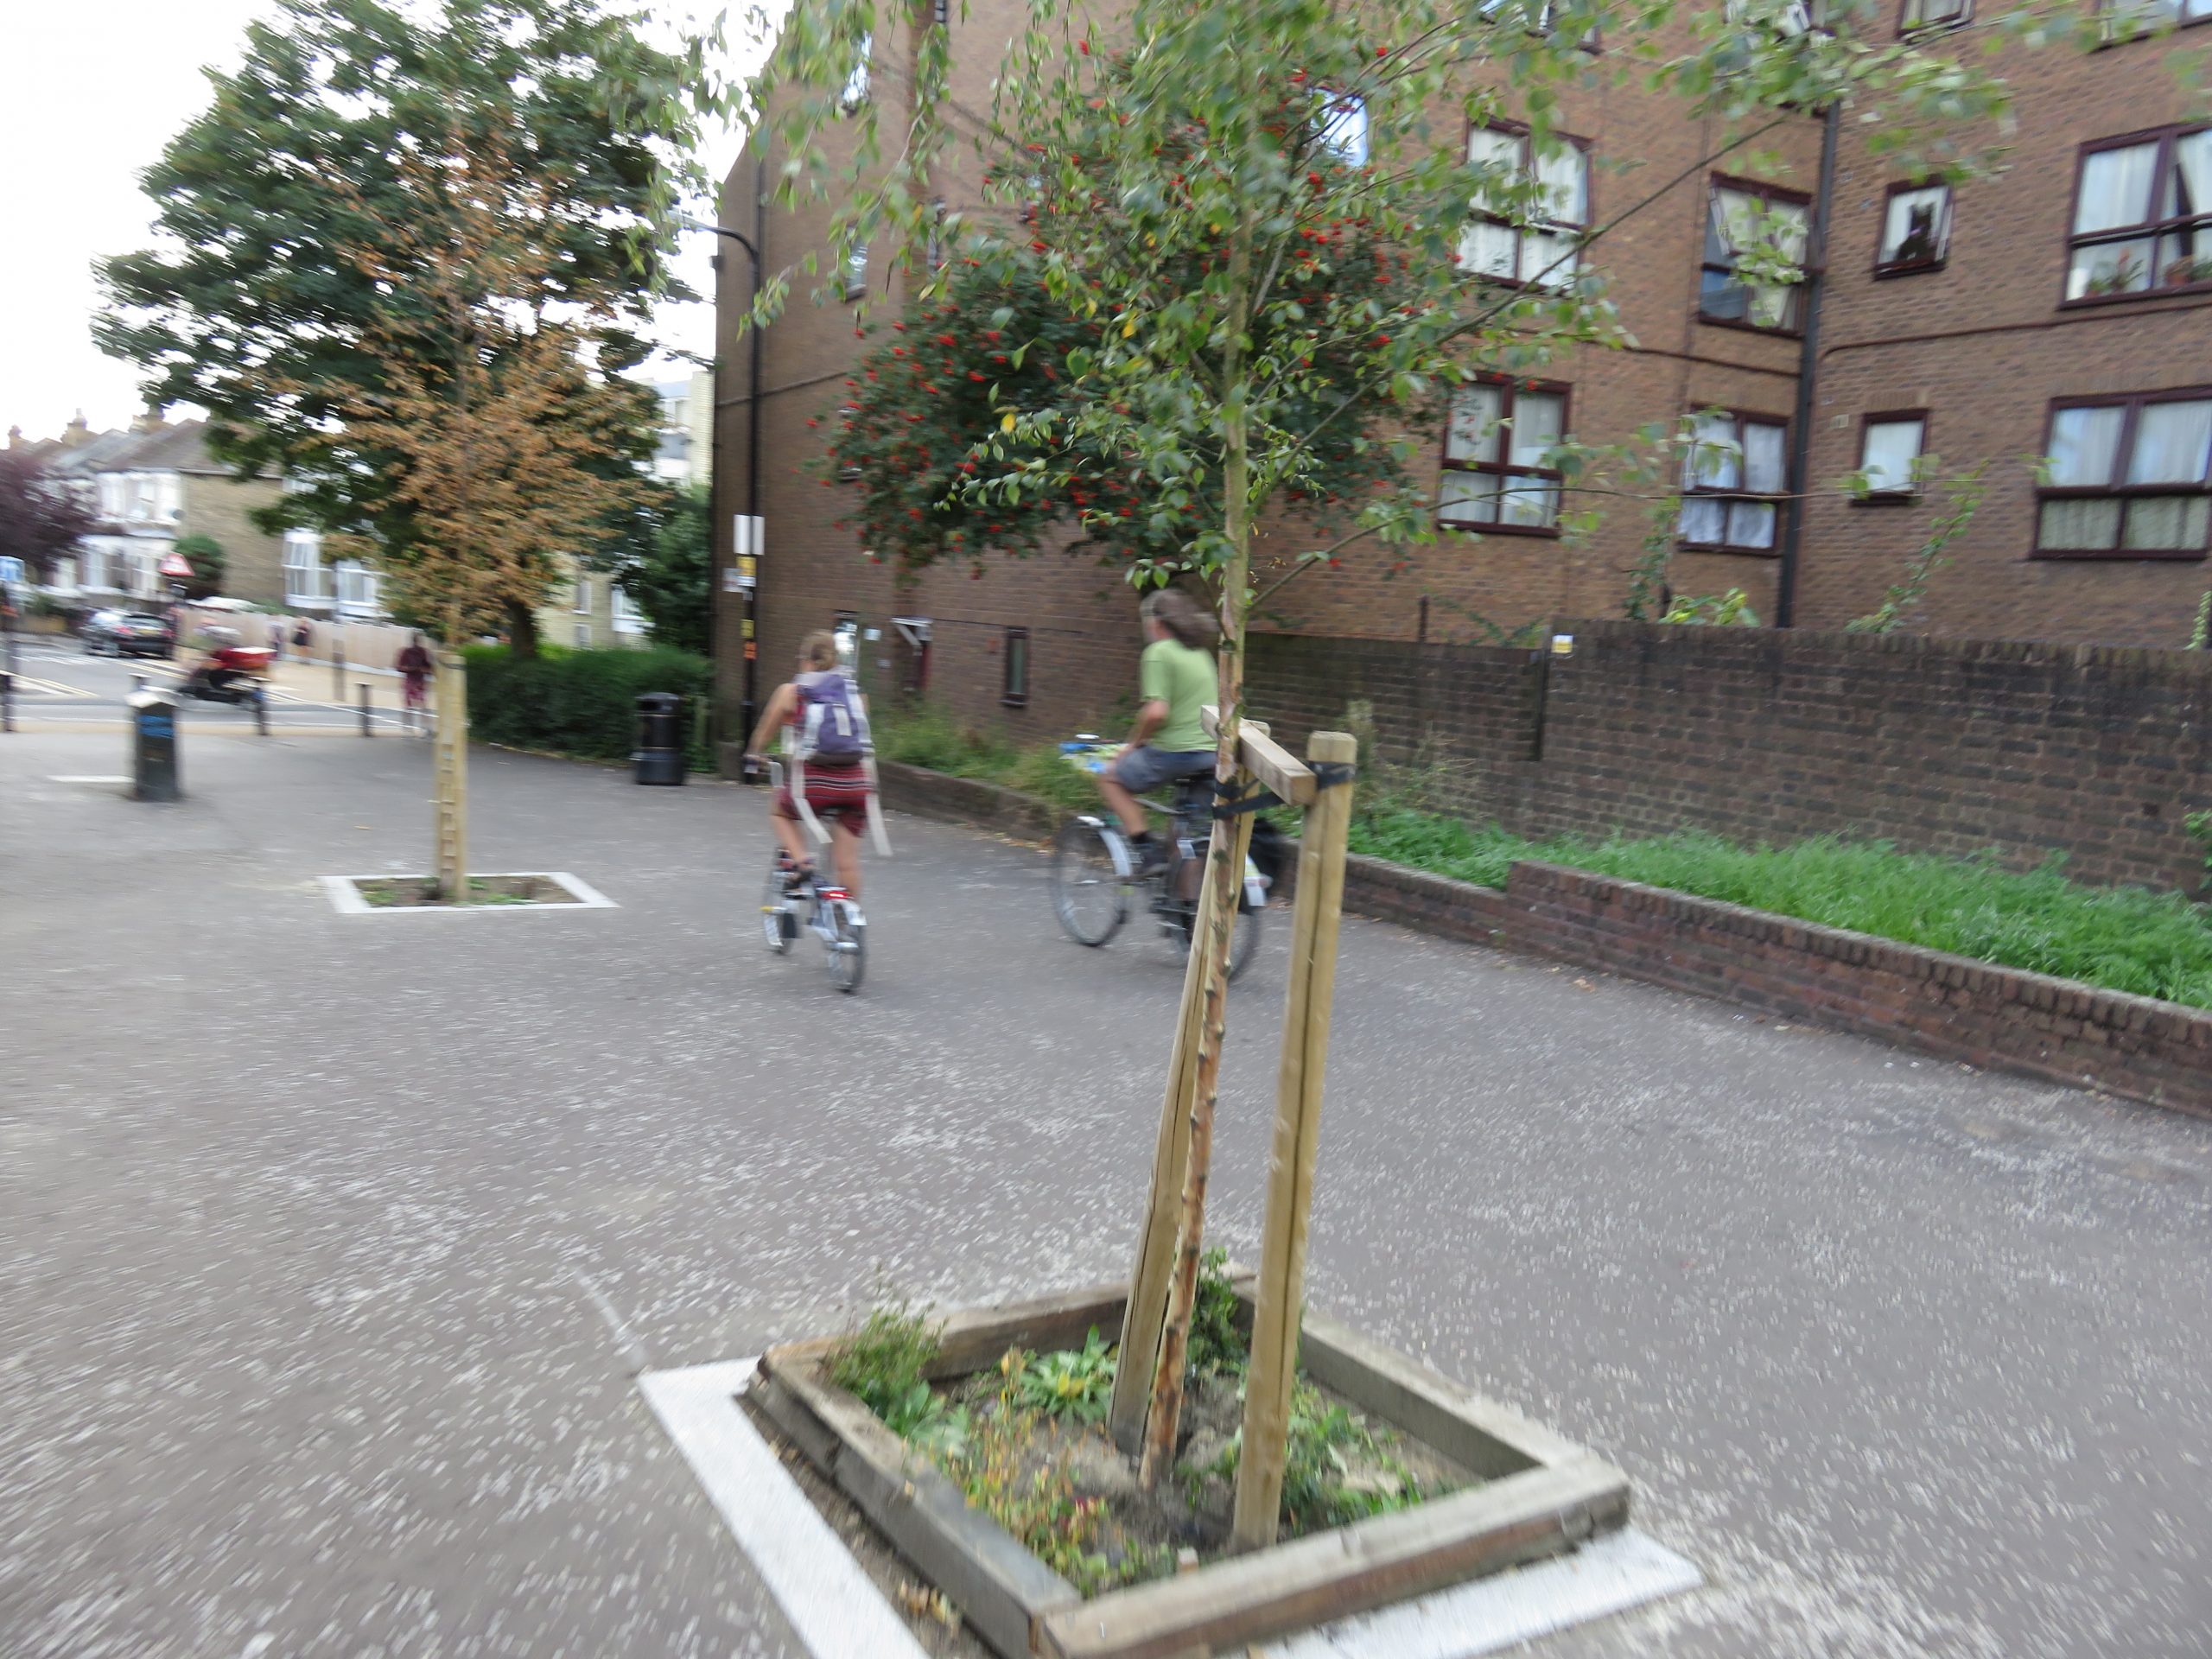
Trees planted in a modal filter, Waltham Forest
Low Traffic Neighbourhoods (LTNs), unlike many high-profile active travel interventions (such as cycle tracks, and pedestrianised city centres) target local areas – ordinary residential neighbourhoods where people live. They have multiple aims – most obviously, to make filtered residential streets truly quiet while still allowing residents, visitors, and deliveries to access all properties by motor vehicle.
This should benefit those living there: for instance, motor traffic levels are likely to fall below 100 vehicles per hour at peak, which according to design guidance in Manual for Streets, represents the upper limit above which ‘pedestrians treat the general path taken by motor vehicles as a ‘road’ to be crossed rather than as a space to occupy.’ In other words, Manual for Streets identifies a qualitative shift around that threshold, between a street being a place where people may wander, dawdle, or play even in the middle of the carriageway, to a movement corridor where pedestrians are relegated to their defined (often insufficient) footway space. Thus the aim of LTNs would be not just to reduce motor traffic by a certain %, but to change the character of those streets such that their entire width is usable by all, not just by those in motor vehicles.
LTNs are, however, not intended only to benefit residents or to increase ‘place’ function. They also aim to improve non-motorised connectivity. Within urban areas, a residential neighbourhood may be adjacent to key destinations, such as a park. An LTN in that neighbourhood will restrict people’s ability to drive through those filtered streets to the park. While this is an obvious benefit for residents (fewer cars cutting through), the filtered streets should themselves then form a much improved route by foot or by bike to the park, benefiting people living outside the neighbourhood, too.
This leads onto another posited benefit of LTNs – the discouragement of unnecessary car trips alongside the improvement of alternatives (principally walking and cycling, although where bus gates are involved, this gives buses a relative boost too). This is in line with evidence suggesting that just as building more roads tends to generate more motor traffic, reducing space for motor traffic will generally reduce motor traffic.
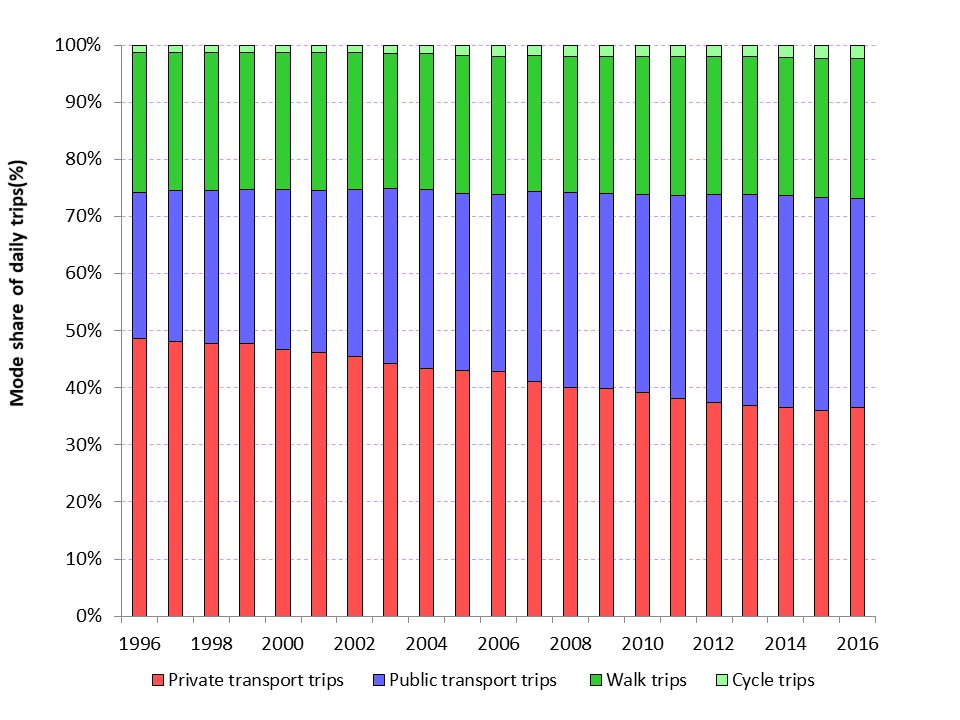
Changes in London’s mode share of trips (Source: Travel in London 10, TfL)
This isn’t magic: it can be as simple as someone realising their usual drive to the park is likely to take longer, looking at the map, realising it could be walkable and trying out the walk instead; discovering it’s quiet and pleasant, and now takes a similar amount of time to the car trip, so deciding to walk in future. ‘Modal shift’ achieved. We’ve seen millions of these kinds of small changes happen across London in the 1990s and 00s, when the major improvements in bus services and priority, and landmark pedestrianisation schemes, alongside an increase in the cost of driving and reallocation of roadspace away from the car, led to a substantial shift away from driving and towards public transport. Over two decades, London residents went from making around half (49%) of their trips by ‘private transport’ (mostly car), to making just over a third of them by ‘private transport’ (36%).
However, while we can identify large-scale change across London and other cities and point to the policy changes we think caused them, it’s often hard to link specific changes to individual schemes. Unfortunately, one does not get the whole picture just from monitoring changes in, for example, cycle traffic – this helps tell us what kind of routes are popular, but not how much of the change is new uptake nor where it came from. We need good evaluation methods to measure changes in travel behaviour but these methods aren’t cheap and their cost is rarely built into schemes up front.
I am lucky enough to have been leading the People and Places study, through which I have been able to look at the impacts of mini-Holland schemes in Outer London. Led by Westminster University and funded by TfL, the project involves a longitudinal study of adults age 16 and over, meaning that we follow the same people year-on-year. In this way we can compare changes in ‘intervention areas’ in mini-Holland boroughs to ‘control areas’ (the rest of Outer London). This controlled ‘natural experiment’ study design allows us to separate the effects of broader changes affecting all of Outer London (e.g. unusually good or bad weather) from the impacts of the programme. The study has focused on changes to walking and cycling (active travel) and has consistently found that living near interventions has led to a 40-45 minute weekly increase in active travel.
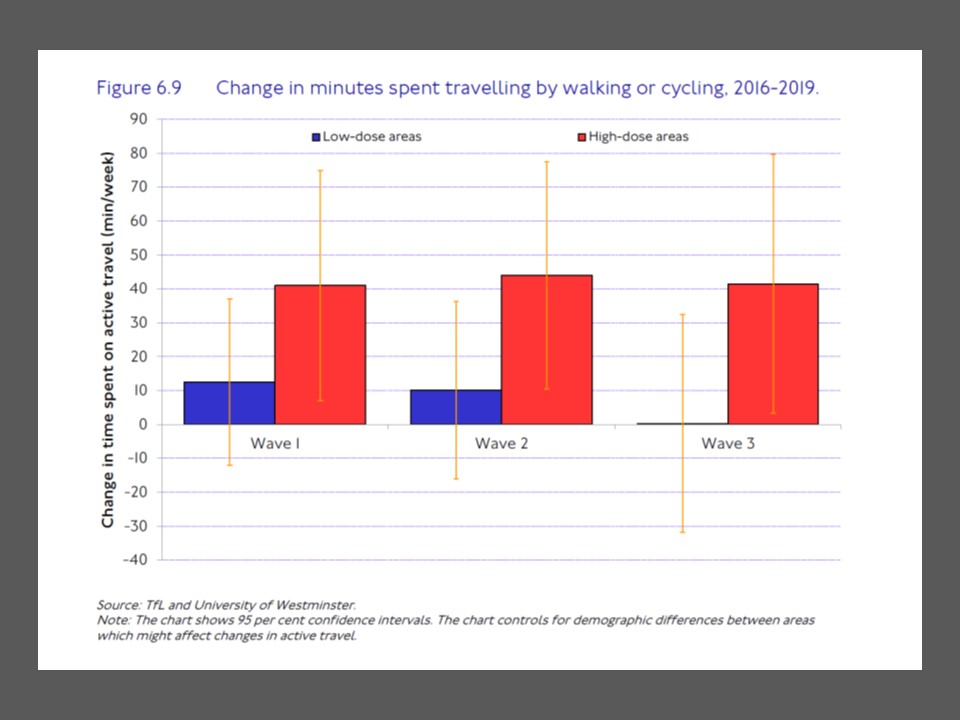
Three-year findings, from Travel in London 12
The People and Places study was not designed to evaluate LTNs. Some mini-Hollands interventions looked very much like LTNs, but others did not. Specifically, only one of three mini-Holland boroughs (Waltham Forest) implemented LTN-type schemes. Kingston and Enfield went for different interventions, generally more route-based; although Enfield has just recently implemented an LTN-type scheme in Bowes Park, and Kingston has now announced plans to introduce LTNs.
LTNs are controversial, as are many schemes that seek to restrict car use, and so we’ve been asked about our findings in this context. In particular, we have been asked what our findings mean in relation to ‘traffic evaporation’ – i.e. the extent to which measures like LTNs may lead to an overall reduction in motor traffic across an area. We had reported no statistically significant change in car use in our Wave 1 (2017) findings among residents of intervention areas, as published here. Amount of car use, like amounts of active travel, was measured in two ways: firstly, by any use in the past week, and secondly, by minutes using the car during the past week.
In more detail: ‘For past-week car use, there was a non-significant trend for those living in mini-Holland boroughs to be less likely to report any past-week car use than those living in non mini-Holland areas (p = 0.10). This trend was observed in all three mini-Holland boroughs, and the point estimate was somewhat stronger in the high-dose mini-Holland group than in the low-dose mini-Holland group although the differences were again not significant. Time spent driving in a car in the past week showed no consistent pattern in the results.’
So, does this mean that mini-Holland and/or LTN schemes don’t reduce driving? And can we say anything about how effective LTN schemes are, as opposed to other types of mini Holland scheme, in relation to active travel? With Anna Goodman, who’s worked on the project with me from the start, I’ve been doing some additional analyses of our dataset which address these questions more explicitly than anything we have published so far. We do so in all 3 years of follow-up data we now have available, Wave 1 (2017), Wave 2 (2018) and Wave 3 (2019), comparing these with the baseline year of 2016. Having three years’ follow-up provides us with more insight on trends – for instance, a weak trend that does not appear again is likely to be a blip, whereas a weak trend that replicates in a subsequent year is more likely to represent a real effect.
We have submitted an article entitled ‘Low Traffic Neighbourhoods, Car Use, and Active Travel: evidence from the People and Places survey of Outer London active travel interventions’ to a peer-reviewed journal, and uploaded a pre-print here. We have also uploaded a pre-print of our main three-year findings paper here.
That main findings paper discusses in more detail headline findings reported in TfL’s Travel in London 12, and uses Transport Appraisal Guidance methods to conduct an assessment of the physical activity and absenteeism related impacts of the schemes. It concludes:
‘These findings provide confidence that even in more car-dependent, suburban areas, active travel infrastructure can spur take-up, and that such growth can provide high health economic benefits in relation to intervention costs. Policy-makers should not however necessarily expect this take-up to immediately appear as increases in cycling; initially, active travel growth may manifest itself as increased local walking. Hence policy-makers should monitor changes in walking levels, which are often left uncounted; and (especially given controversy over cycling interventions) highlight the likely impacts of mini-Holland type interventions on walking.’
The LTN paper, by contrast, focuses on car use as well as creating a new subdivision: separating out LTN-type areas from other ‘high-dose’ intervention areas; which might be, for instance, near a new cycle track or a new pedestrian route, but not within an LTN area. We decided to look at car ownership as an outcome variable, which we haven’t done before. Having three years of follow-up means that we could better judge whether trends might be more likely due to chance; although note that there is plenty of uncertainty about the size of impacts (confidence intervals are wide) for the LTN group, as (depending on the wave) this is between 46 and 66 people.
Full detail of the results can be read in the papers, but to summarise the findings related to LTNs here:
In relation to car ownership, there is a consistent trend towards people in the LTN area being less likely to own a car, with the point estimate growing larger and more statistically significant in each subsequent wave (Rate Ratio (RR) 0.92, p=0.15 in Wave 1; RR 0.89, p=0.08 in Wave 2; RR 0.80, p=0.01 in Wave 3). Note that values less than 1 indicate a decline for the ‘%’ variables, while values less than 0 indicate a decline for the ‘minutes’ variable. A RR of 0.80 approximately corresponds to a 20% decrease in the adjusted probability of car ownership. By contrast, there was no evidence of any change in the ‘low-dose’ or ‘high dose, non-LTN’ groups.
In relation to whether a participant reported any past week car use, the largest decrease was again always the LTN group, with the effect significant in Wave 2 (RR 0.78, p=0.02) and borderline significant in Wave 3 (RR 0.81, p=0.08). There was a suggestion of a trend towards less past week car use in the high-dose, non-LTN group (RRs 0.93 to 0.96), but the point estimate was always smaller and never close to statistically significant.
As for minutes of past week car use, the point estimate in the LTN group was always negative (i.e. a decrease in time spent driving) and always lower than any of the other groups. The central point estimates were for a decrease of 10 minutes/week in Wave 1, 43 minutes/week in Wave 2 and 17 minutes/week in Wave 3. The confidence intervals were wide, however, and only in Wave 2, was the effect statistically significant (point estimate 43-minute decrease, p=0.007). That past week minutes of driving shows a decrease is notable as a concern sometimes raised about LTNs is that one may see some mode shift away from cars, but if all the remaining car journeys have to take more indirect routes on more congested roads then those car journeys will become longer and slower, and so the total volume of driving and pollution will go up. Our findings of a trend towards decreasing total weekly duration of car driving provide some evidence against this concern.
In summary, there was a consistent trend towards reduced car use in the LTN area for all three of these measures, with the effects particularly large in Waves 2 and 3. Confidence intervals were always wide, particularly for minutes of car use, but three of the six results from Waves 2 and 3 reached statistical significance and a further two were borderline significant. Despite small sample sizes, these results are therefore unlikely to be due to chance.
We also looked at our primary active travel outcomes in relation to these sub-groups. In general, in 16 of the 18 contrasts analysed, the point estimate was largest in the LTN area. Typically, the second largest was the high-dose, non-LTN area. Despite the small sample, many results for the LTN area reach statistical significance (4/6 for walking; 3/6 for cycling; 5/6 for active travel combined). The consistent pattern is therefore that one gets the largest active travel benefits in LTN areas, even larger than areas that still got a lot of high-quality new infrastructure but were not in an LTN.
It is also interesting to compare the magnitude of the estimated increases in active travel with the decreases described above for minutes of car use. The estimated increases in active travel are substantial in the LTN areas, albeit with wide confidence intervals, with point estimates of 94 extra minutes per week in Wave 1 (p=0.01), 67 minutes in Wave 2 (p=0.04), and 134 minutes/week in Wave 3 (p=0.006). By comparison the point estimates for decreases in car use were 10 minutes in Wave 1, 43 minutes in Wave 2 and 17 minutes in Wave 3. We cannot make definite statements about proportions given the wide confidence intervals, but the results seem most consistent with some of the increase in active travel reflecting mode shift away from car use, and some reflecting additional, brand-new walking and cycling trips or a mode shift away from public transport.
No mention level of traffic on roads onto which traffic has been displaced. Does this drop back to below the level pre LTN? This seems like an important criteria for judging the success or otherwise of the project.
Hi Nick, the study measures travel behaviour and attitudes over time of a sample of participants in Outer London. We don’t count traffic on roads – I agree this is also an important and useful thing to look at, but outside the purview of our research.
How can this very important aspect which pushes the traffic on main roads be left out? I would rather have 100 cars per hour than have 50 cars waiting in traffic time idling for 5 hrs… The LTN is wrongly designed. We should block off high streets and let the traffic find ways of evoparay
Could this be something you could look into please? We live on one of these boundary roads so this is obviously something which concerns me. Do those living on a boundary road see a large increase in stationary traffic over time?
Hi Nicola – IMO traffic counts (including walking & cycling counts) should generally be done by local authorities as part of their scheme monitoring (not just for LTNs but more generally) – also so that tweaks and changes to schemes can be made as needed in real time.
Is Ealing going to consult with Hounslow over EBC appropriation of HBC’s Road -Swyncomb, gor the scheme which I see HBC is so angry about they are threatening to close it? Ahead of the Neev Road Traffic Act updates, Is EBC going to require riders to have insurance, to wear helmets & hi vis, to have a road safety certificate/ license. To license cycles (would also help with theft prevention)
To repudiate adults riding on the pavements to avoid ques.
To make cyclists travel at the speed limit, stop at street crossings, wait until light changes to set off? Is EBC going to start charging road tax for all road users? If you have a car, are you going to continue to be charged for your use, and all cyclists? If you have a car and a bike, will you be charged twice? As they roll out the new LEZ (north & south circular)
And what about all the driverless vehicles that I saw councils are goin to be championing to share the local roads from 2021?
Less actual people but more robot cars on the streets, not sure how that fits in with safer streets or fewer cars. But I am against these unnecessary vehicles being allowed to replace actual people.
What are the council doing to make sure all their council vehicles are compliant. Is EBC going to get rid of their own car park making their own employees walk or cycle – you could make it a real park, Is EBC going to continue their campaign to entice out of town commuters here to park on our residential streets as they do now, or will that finally be stopped?
It does contribute both to unnecessary traffic/journeys & “rat running”.
I used to drive to shop at Ealing Waitrose once every 2/3 weeks, & do a myriad of smaller chores.
I probably will now just take the E3 to W4 where I work, and do all my shopping there, to fit the new 15 min bubble. Or online, rather than locally. I don’t want to walk everywhere & I don’t want to cycle everywhere either, two unfortunate falls & resulting ops have made one limited & the other quite tricky. Cycle theft is at an all time peak, and literally nothing seems to stop it. The number of expense vandalised hulks changed to lamp posts is appalling & cautionary. No bike, new, old, well locked up, even in many cases locked in a shed or garage is safe. Is EBC going to publicise & hold regular Mark It. Sessions like one next week in Blondin Park?
It means a lot of businesses will suffer even more than they are.
Because the reality is not everyone sits on their ass for work which can be done anywhere.
There are many inaccuracies in your comment. Firstly there is no such thing as ‘road tax’. There is an excise duty which is calculated on transmission and axle weight. Some types of car are exempt from ‘road tax’ and all cycles would be anyway. Should pedestrians pay ‘road tax’? They are road users.
Many cyclists are insured both for theft and third party liability. In fact, so low is liability deemed by insurers that insurance is given away free to members of cycling clubs / groups such as Cycling UK.
Insuring and taxing motor vehicles has not eliminated road deaths and serious injuries caused by motorists speeding, drink driving, using mobile devices etc. According to Police stats 1 in 8 vehicles is uninsured. In comparison, the damage to the environment, to injuries and deaths of other road users caused by cycles is minimal so a ‘tax’ and insurance scheme on cycles would be costly, difficult to administer and pointless. Would children’s bikes be ‘taxed’.
Red lights. I would recommend an easy experiment. Go and stand at a busy traffic light junction for 30 minutes. And count how many pedestrians cross when it’s red, how many motor vehicles ‘jump the lights’ or go through red lights. (And how many drivers are using a mobile device) And as for speeding cyclists – the urban speed limit is 20 or 30 mph. If speeding is an issue then we need to check what these cyclists are eating and drinking. To persistently peddle above 30mph (or even 20) requires Herculean stamina and fitness.
Personally, I don’t think it is rocket science to say you are finding decreases in car use and an increase in walking in areas where it has been made more difficult to use a car – i.e. LTN schemes where roads have been closed to through traffic. The first comment raised here by Nick (above) is probably the most pertinent, but one not considered by this research – what the impact has been of the LTNs on surrounding roads and neighbourhoods. The FoxLaneLTN, about to be introduced by Enfield, is intended to displace 50,000 weekly car journeys from Fox Lane to neighbouring main roads, already the busiest in the area, by closing a dozen largely quiet side roads. The Council’s Deputy Leader Cllr Barnes has claimed this must be done to reduce pollution and help combat climate change, and says that traffic evaporation will achieve this. There is no evidence I can see to support this in this research.
Here’s something that you can do other than the upkeep and maintenance of the highway just leave the roads alone because no one has done a real Impact Assessment on how this is going to effect community at hand and how’s it going to affect but emergency services and their response times or taking into consideration the needs of the elderly and Disabled People Who find getting around difficult as laid out in the disabilities Rights Act. Bottom line don’t tinker and just leave the roads alone.
Following on from Gus Stevens comment I can assure everyone that the traffic from Palmers Green has not evaporated it has been forced onto residential roads in neighbouring Haringey. Our residential roads are now busy from 6.0 am blocked by 8.0 am and evaporated by 10.am
Haringey’s answer. Block off our roads so everyone eventually becomes a prisoner in their tiny area. Apart of course the (mainly) white, Lycra clad young men) who are now king of the road. But I have noticed the do not transport their shopping or children . Wonder who is struggling along with these?
The whole scheme furthers inequality in every way.
I live in a new LTN, tonight the silence is actually quite eerie and reminiscent of lockdown when I felt quite personally unsafe as a lone female walking in the streets. That feeling has returned.
Have there been studies about LTNs and personal safety once the deterrent of through traffic is lost?
I’m very relieved that I don’t have to go out tonight but also very claustrophobic at the prospect that I no longer can with the same level of confidence.
Hi Louise, this is an interesting point and one a colleague has started looking into in relation to Waltham Forest. Initially it looks promising, i.e. initial look at the numbers suggests that generally the trend in those areas looks like it is the same or better than other areas. Still some work to do though looking at the figures. My feeling is that probably pedestrian (and maybe cyclist) volume are more effective in reducing these risks than are passing drivers (and if LTNs increase the amount of walking, hopefully that will help with natural surveillance). Of course, perceived safety’s also important, and might be improved by changes such as improved lighting and cut back bushes allowing better visibility.
The quieter neighborhood project has not been well thought out by the council properly, who went ahead and implemented the flower beds before consulting us all. They just jumped at the chance to grab the money offer by LTN. This project has not taken into consideration the elderly or disabled at all. My mother cannot walk and needs to be driven, not cycled, but driven to important places such as her GP which is now in a blocked off neighborhood. If a car cannot be used than her whole quality of life would be affected and she would be housebound. Doctor’s surgeries have now been more difficult to access and traffic has been diverted onto not just a busy road but on to North circular road which is like a motorway and extremely busy. What would have taken 5 minutes down the road, is now taking nearly an hour and that’s if there is no problems. The people in charge of the project refuse to listen to arguments against as they have taken the funds and believe they are in the right, with no consideration for others whose lives have/will be disrupted. You cannot cater for one set people and not others, you need to find a compromise for a balance and that means takings everyone’s views into consideration. Life is difficult as it is, without causing more misery on the working class people, who need to drive to get by with not only work commitments, but personal caring responsibilities. Not everyone can cycle to work or do their shopping on a bicycle. Small businesses will suffer in surrounding areas also, but I doubt the council cares.
LTNs are not about ‘blocking off’ neighborhoods. They reduce through traffic but allow local access. It may mean taking an alternative route. If the journey you mention was previously 5 minutes – but now one hour (which seems unlikely) then it is precisely the 5 minute journey that needs to be reduced or taken in an alternative way. The LTN does not mean residents cannot use their car – it means that non residents cannot use the area as a through route. Opponents of LTNs often use the disabled and elderly as a reason for opposing LTNs. But it is rat runs, busy roads, fast traffic that prevents local roads from being used by elderly people, the differently abled, children. Reduced traffic opens up the environment for other road users to move about safely and comfortably.
The traffic however is not reduced on the roads that people need to use to get around. The point is that LTNs push more traffic onto the already busy and often highly residential main roads. Those roads become even more congested. It follows that the previous 5-minute journey is extended. And yes the disabled and elderly now find that if they want to make a car journey, say to the hospital, then that now takes a lot longer because the alternative routes that used to facilitate speedier journeys have been cut off. And of course, the residents on those main roads now have to suffer more pollution.
Equality Impact assessment for leading Waltham Forest low trafic neighbourhood can be found on page 40 of this report: https://www.enjoywalthamforest.co.uk/wp-content/uploads/2015/03/150901-Villages-Blackhorse-PLM-Signed.pdf
We live in the road in Surbiton where the LTN barrier has been installed a few weeks ago.
Already we have noticed a welcome decrease in traffic especially at rush hour when our road was used as a rat run away from the main Ewell road into Kingston.
This has made our road quieter, safer and has reduced traffic pollution.
The objections to the barrier were mainly made by non residents who made a habit of using our road as a rat run.
I hope that the LTN measures become a permanent feature in our area.
Thanks very much for this report, it’s very encouraging. I support the development of LTNS and their equivalents, and there appear to be a number of success stories across London. However, to echo Nick Roulstone above, I live on a road on boundary of a recently created LTN in SE London. Previously it and the surrounding streets on the boundary of the LTN were quiet, narrow residential roads. Unfortunately, as a result of the implementation of the nearby LTN, we are now a morning rat run, with several negative consequences: the air quality is deteriorating, pedestrian safety has been compromised (cars and vans are mounting pavements to pass one another), and across the neighbourhood broadly the issue has proved deeply divisive. We have discussed requesting that our local network be added to the nearby LTN, but that would merely push our problem to nearby streets. If you were able to point me in the direction of any research into the effects of boundary roads of LTNs and their equivalents, I’d be grateful. Or any research that shows that such collateral damage is a necessary part of the process that leads, ultimately, to an improved social environment. As I’m say, I’m in favour of LTNs – but in our local example at least, there appears to have been inadequate consideration of the negative effects on surrounding roads. Any thoughts much appreciated!
Hi Mike, thanks for your comment & a quick response from me: 90%+ of Londoners live in residential streets, and having seen in particular the impact LTNs & related measures have on walking levels (which has such big health benefits), I think potentially much of London’s street network could be treated in this way. My own home borough now has plans to introduce LTNs across the whole borough, and they’ve extended schemes to streets that have previously been defined as boundary roads (but which are residential), now seeing these as also suitable for motor traffic reduction measures. I also think that there are lots of other things that need to be done alongside LTNs! There are many measures that can help improve main roads, and reduce exposure to pollution on those roads for people living there and/or using those roads. It’s important I believe to create better walking and cycling conditions on those roads, which can help particularly shift trips to cycling – we won’t see the full potential for cycling with LTNs only, if main roads remain hostile. Some of the 10% who don’t live on residential roads live on high streets, some of which (as in Waltham Forest) may be LTN-able, or suitable for part-pedestrianisation. Wider measures to get the most polluting vehicles off the roads also have a strong impact. Between 2016 and 2019 London saw substantial reductions (not enough!) in air pollution particularly in central and inner areas, thanks e.g. to the LEZ and to measures to take the most polluting diesel buses off many of those routes (see https://www.theguardian.com/environment/2020/oct/03/dramatic-plunge-in-london-air-pollution-since-2016-report-finds). The ULEZ will have major benefits for much of Inner London, and could be extended to the whole city. Happy to chat further by email if helpful 🙂
Thanks very much for that wider context, Rachel. I’m afraid that LTNs have become a fraught term. To see them within a network of measures helps. I suspect – but don’t know – that the implementation of certain LTNs during the pandemic is itself consequential. There are those looking for certainty and stability in the tumult of the pandemic, and there are those who see it as an opportunity for step change. The appearance of a nearby LTN, with the attendant change in traffic patterns, rather becomes a lightning rod for those quite opposing impulses. The result is the polarised responses that we’ve all seen. Also, I imagine that those at the forefront of transport research and policy development are some way ahead of the populace (me included). Thanks for the invitation to email, couldn’t find yours, mine I’ve attached with this comment, do drop me a line if you’d like.
Living Streets publication “A Guide to Low Traffic Neighbourhoods” asserts that LTNs do not increase congestion/ pollution on main road but that traffic eventually “evaporates”, their evidence for this being rachelaldred.org/writing/thoughts/ disappearing-traffic. Can you direct me to this evidence as I was unable to locate it.
The same publication refers to Waltham Forest Council’s traffic counts (http://www. enjoywalthamforest.co.uk/work-in-your-area/ walthamstow-village/comparison-of-vehiclenumbers-before-and-after-the-scheme-andduring-the-trial/) which in fact show a 28% increase in traffic after the scheme on one of the roads bordering the mini-Holland area (Shernhall Street ). Vallentin Road where I live leads off Shernhall Street, and has seen a 32.5% increase in daily vehicle traffic, resulting in daily gridlock, dangerous driving, road rage, noise and air pollution.
Individual residents have sent many videos of such incidents to LBWF, whose eventual response was to increase traffic flow by removing. As a group of residents we are in the process of putting together a proposal to reduce traffic levels in our road. In your view, does the fact that we are a two way bus route for one single decker bus rule us out for becoming a full blown LTN? We envisage asking for a bus gate with ANPR and closure to other traffic. Is there another solution you could recommend for us?
Hi Maggie, the SACTRA report that found the link between reduced capacity and traffic evaporation is here – https://www.cycling-embassy.org.uk/sites/cycling-embassy.org.uk/files/documents/Traffic%20Impact%20of%20Highway%20Capacity%20Reductions-%20Assessment%20of%20the%20Evidence.pdf
Bus gates are often used in cases where you want to maintain bus routes but remove other traffic, e.g. on high streets. Happy if you would like me to comment on the draft proposal you mention – email me at r.aldred@westminster.ac.uk.
The Cycling-Embassy publication cited is from 1998. It features only initial results. Surely there is follow-up information? I live on a boundary road to a new LTN and the air quality and noise pollution from displaced traffic is now appalling. Surely we need more robust data than an initial study from 1998?
Hi Carol, the Cairns et al study is indeed a bit old now: but it was a substantial funded study that considers a lot of diverse examples from different countries, and establishes the general point re: the existence of ‘traffic evaporation’ when motor traffic capacity is reduced. It also establishes well that the impacts of schemes that reduce motor traffic capacity vary by scheme type and context (e.g. you tend to get less traffic evaporation if there is lots of nearby spare capacity). I very much agree that we need more studies specifically about current interventions and it’s good to see monitoring reports starting to appear that are attempting to separate out LTN impacts from wider background changes (particularly important in Covid times where we’ve seen such large background fluctuations); with colleagues I am also starting to do research into pan-London schemes as more data becomes available.
I live in an LTN that was completed in 2017, 95% of minor roads are now access-only only for motor vehicles, this has created an extensive network of low danger streets for people to travel around on, accessing schools and shopping areas with only short sections of those trips being on main roads. Main roads appear broadly the same as they were before, sometimes there are queues of drivers at some boundary road major junctions, sometimes there are not. Some people stated it was a divisive scheme but nearly 4 years on, there is little evidence of that in community discussion. It was only ever a minority who were vehemently against any incursion on driving convenience. I suspect those people are still driving because of course you can still drive if you need too. In parallel to the LTN, the council have introduced protected cycleways on boundary roads along with new and improved crossings too. What we need now is a really smart distance-based road pricing system city-wide.
The LTN’s in Acton are terrible and have caused my journey to work to double because of the main road that is now completely blocked all the time. We have pedestrian walk ways and we have streets for cars. People complaining about the danger of cars driving over the streets in their neighbourhood should just use the pedestrian instead of walking on the street maybe???
I didn’t realise that I couldn’t pass those flower pots first. I didn’t see the street signs and had to concentrate on not hitting the traffic filters with my brand new car. I honestly thought that it was some sort of street narrowing to prevent wide vehicles from entering the neighbourhood. I went through these traffic filter for 2 weeks every work day twice a day. Now I have received my first few penalties for the same stupid mistake that I wasnt aware of. This is a cash grab and i will most likely have to pay a whole month worth of penalties now. I’m very angry and just want to leave this country forever. So disappointing how corrupt the council Ealing has become. Thank you so much. Sincerely, your tax payer.
Why is it that all the research fails to monitor the impact on those ‘boundary’ roads either side of the new LTNs. All this talk of traffic evaporating does not bear out when you are now faced with additional congestion on a shrinking road network, trying to get out onto these roads is difficult and what about those peoples health? But then again if you live in an LTN you’re ok and fully supportive of the scheme because you all benefit. The majority win as long as the LTN has a large catchment area.
Hi there, we have tried in our own research to look at impacts on boundary roads – e.g. our papers on fire response, crime, and injuries look to see whether there are impacts on LTN boundaries (as well as within LTNs), and our equity study also compared characteristics of people living near boundary roads with people living in LTNs. It’s not always possible to do but we do attempt where we can/where we think there could be impacts. We’re doing more research now on 2020 LTNs that will include boundary road impacts, although sometimes data is only available with a lag so it takes time to get the data and do the analysis. Local authority monitoring reports are also appearing now and generally include attempts to measure any impacts on boundary roads in terms of traffic volumes etc. – here’s a few links as examples: Lambeth, Hackney, Islington.
Lyn’s suffer from a number of major flaws, not least parcel deliveries. How are Royal Mail and other parcel and food delivery firms supposed to carry out their job if the street they want to get to is blocked off? I for one am fed up with all these unnecessary restrictions to traffic flow, which far from being safer and more environment friendly have precisely the opposite effect, having to make a lengthy detour for a drop just a couple of streets away.