

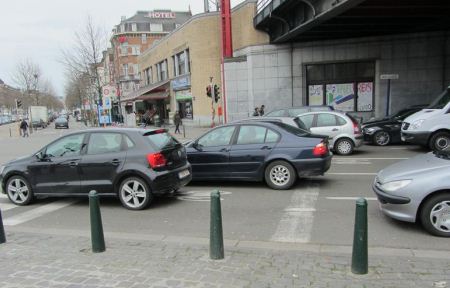
Scary road in Brussels. I instantly felt I wouldn’t want to cycle here.
With both academic and advocacy hats I am working on the question of when cyclists need protected space. Generally design guides agree that high volume and/or high speed motor traffic deters people from cycling, and that if these conditions remain, creating a good cycling environment will mean providing protected space. Here, David Hembrow critically reviews Ontario’s guide in respect of these criteria.
But how much is too much motor traffic? (Leaving aside the question of speeds for today). As cyclists we sometimes instinctively feel that a road is too busy for us to cycle (as in the photo).
But do we have good ways of assessing what level of motor traffic is too high for most people to cycle? The question is very important when it comes to designing and evaluating transport schemes.
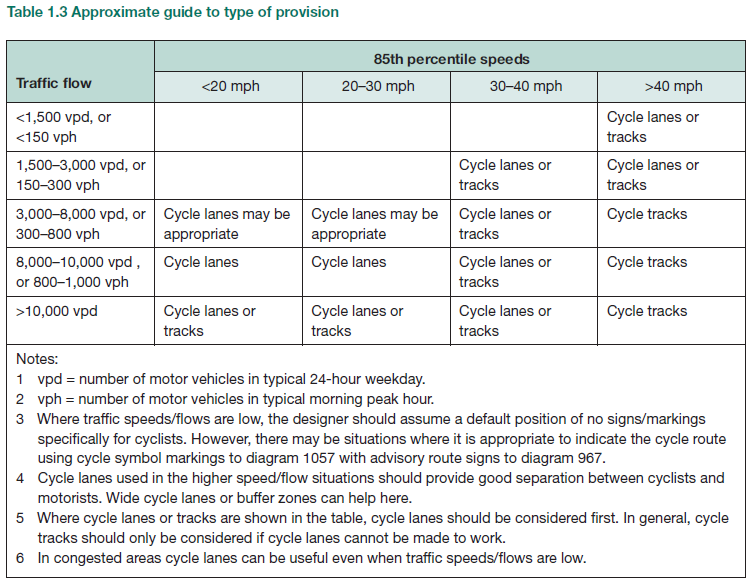
From Cycle Infrastructure Design, LTN 2/08, page 13.
The UK guidance, Cycle Infrastructure Design (Local Transport Note 2/08, LTN 2/08) has, like other manuals, thresholds for when cyclists should be separated from motor traffic in some way. Speed features as does volume – here I just focus on the latter. I would argue that the volume (and the speed) thresholds given in LTN 2/08 are too high to promote mass cycling; however, there is a broader methodological problem that must also be resolved when this table is revised (as I hope it will be). The table uses ‘Vehicles Per Day’ (VPD) and ‘Vehicles Per Hour’ (VPH), referring to motor vehicles. But surely it makes a difference whether those (for example) 1,500 motor vehicles passing in an hour are made up of 1,500 cars, 1,500 articulated trucks, 1,500 buses, or 1,500 motorcycles? Of course, it’s often a mix of all of these. But the type of mix will play a substantial role in determining both the riding experience and the level of risk.
In my view, the Dutch CROW manual correctly rejects VPD/VPH, acknowledging that not all motor vehicles are equal. Instead, CROW uses PCU values (Passenger Car Units). For main cycle routes, the Dutch limit is meant to be 2,000 PCUs in a day (which might equate to 200 PCUs in a peak hour period, given the tidal nature of flows). I think this is rather more conducive to mass cycling than the higher limits given in LTN 2/08.
But where does a PCU come from? The measurement derives from the attempt to draw equivalences between vehicles in terms of how much space they take up within the traffic stream. For bicycles, the figure often given is 0.2 PCU. In an earlier post I discussed the problems with using a fixed bicycle PCU for modelling traffic flow. (Interestingly I have recently heard that in the 1960s UK traffic modelling sometimes used variable PCUs for bicycles, rising to 0.5 at roundabouts).
But here again, there’s a broader problem. Is the PCU – a highway capacity measure – really suitable for assessing cycling environments? The PCU figures used for different motor vehicles can vary. Here’s what is given in the London Traffic Modelling Guidelines (page 67):
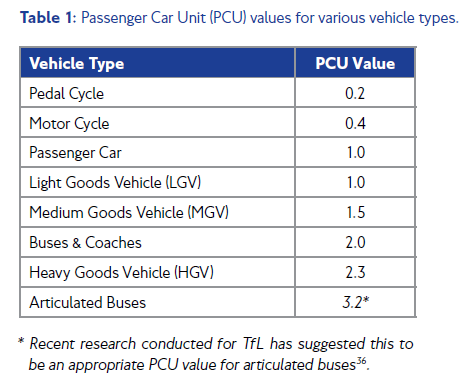
So, we have 2.0 for buses, and 2.3 for a HGV. In other words, if using PCU values to assess cycling environments, each bus you have to interact with is the same as interacting with two cars. HGVs, slightly more than two cars. And interacting with a motorbike becomes less than half as problematic as interacting with a car.
Now I suspect this doesn’t matter too much to the Dutch. They often exceed their standards (while in the UK we have so often struggled to get what is meant to be the absolute minimum). Moreover, they separate cyclists from large vehicles. For us, if these figures fail to capture the real risks and unpleasantness caused by different motor vehicle types, it’s rather more of a problem. In terms of risk, as well as in terms of experience, 100 cars really aren’t the same as 43 HGVs, but that’s what the PCU calculation would suggest.
We surely need a coefficient – the Dutch are right – rather than just adding up the total number of all motor vehicles. But how would an alternative coefficient work? My suggestion is, to shift from PCUs to, if you like, VRUs, or Vehicle Risk Units. We would then compare the risk each motor vehicle mode poses to cyclists, relative to the vehicle km travelled by different types of motor vehicle.
So I went to Morgan et al’s paper on Deaths of cyclists in london: trends from 1992 to 2006, which contains some information on the causes of deaths during this period. There were 242 deaths involving a cyclist fatality; seven didn’t involve any motor vehicles, and for nine no information was available on other vehicles. Of the 225 remaining deaths, 103 involved freight vehicles, 105 cars, light goods vehicles, or taxis, 12 buses and 6 motorcycles. Morgan et al point out that ‘To put these figures into context, for the period in which traffic flow data is available (1993-2006), goods vehicles (as defined by TfL) accounted for approximately 4% of traffic flow, cars and light vans 91%, and buses and powered two-wheelers 2% each’.
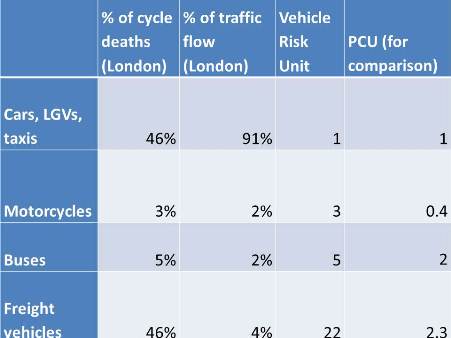
VRU compared to PCU – calculated from London figures in Morgan et al 2010
I think a good start towards creating more inclusive cycling environments would be for us to start using the VRU method for calculating maximum motor vehicle volumes. We could use it with the Dutch limit figure of 2,000 motor vehicle units per day on main cycle routes (treated as a real maximum – protected space might in some cases be provided at lower levels of traffic flow). A Vehicle Risk Unit concept could be part of a shift towards really thinking cycling when planning for cycling. It’s about a change in mindset: thinking what makes a good cycling environment, rather than adapting things we do to think about making a good motoring environment.
Pingback: Space for cycling confirmed as separation from motor traffic | As Easy As Riding A Bike
Pingback: Edmonton: Aim for an Cycling Minimum Grid | Urban Reality