

So, I’ve been working on measuring rat-running. It’s more complicated than you’d think, largely because our tools, our models, the way we collect and analyse data, were generally set up to support private motorised transport, not to analyse its adverse impacts. (Petter Naess has a nice piece on this here). And data is often not available even if collected. Anyway, I’ve made a start. This is Part 1, developing a basic method to calculate what isn’t rat-running – i.e. how many motor vehicle movements a household and hence street might generate, without any other traffic cutting through.
Let’s say we’re talking about basically residential streets (this doesn’t imply completely monofunctional streets – the basic method could be adapted to incorporate shops etc. along the street – but it’s easiest to start with that assumption!) so ‘local only’ motor traffic movements can be estimated at a per-household level.
This might consist of several sources:
(i) the most obvious: motor traffic movements generated by trips involving people in the household, by any private motorised mode, involving a household vehicle or another vehicle (e.g. visitor’s vehicle, taxi, work vehicle)
(ii) motor traffic movements generated by servicing, such as plumbers’ visits; and personal visits to an address made by people not part of the household (friends and family coming round)
(iii) home deliveries to people in the household.
I started off with (i) as numerically the most important and having the most easily available data. And here I came across my first problem. While travel survey reports give us figures for trip rates per household or per person (590 one-way car driver or passenger trips per person, per year in 2014), the number of motorised person trips will be significantly higher than the motor vehicle movements generated in the person’s home area. Firstly a ‘trip’ may be a trip from work to a meeting, for example, and so not generate any motor traffic in the person’s home location. But perhaps more importantly, one car movement could involve multiple person trips – like a school run trip with one driver and several passengers.
So I needed to do a bit of data analysis to untangle what trip rates might imply for number of motor vehicle movements on the traveller’s home street. I used the National Travel Survey 2002-14, available from the UK Data Archive. Trip rates have been in long-term decline – they’re now 16% lower than in the late 1990s – so this will over-estimate current trip rates.
I started with the trip level dataset, and created some simple rules to estimate private motor vehicle movements based on trip rates. This involved:
– Removing trips by non-motorised or public transport modes (except demand responsive buses)
– Removing all trips where the start or end point was not the respondent’s home
– Removing all trips where the individual was a passenger in a vehicle owned by the household (this being very likely to be a trip where another household member drove, which would be recorded separately for that driver)
I think the resulting trip figures should give a reasonable picture of motor vehicle movements. I then reorganised the dataset from trip to household level, summing the numbers of motor vehicle movements on a household basis, and applied the diary weights. I didn’t just want to create overall averages, which can be misleading: 18 cycling trips per person, per year, for instance (but a very skewed distribution!) Modelling could do this in a more sophisticated way. However, I figured that region and car ownership would be two important predictors of motor vehicle trip levels (and strongly associated with other trip predictors such as household size and income).
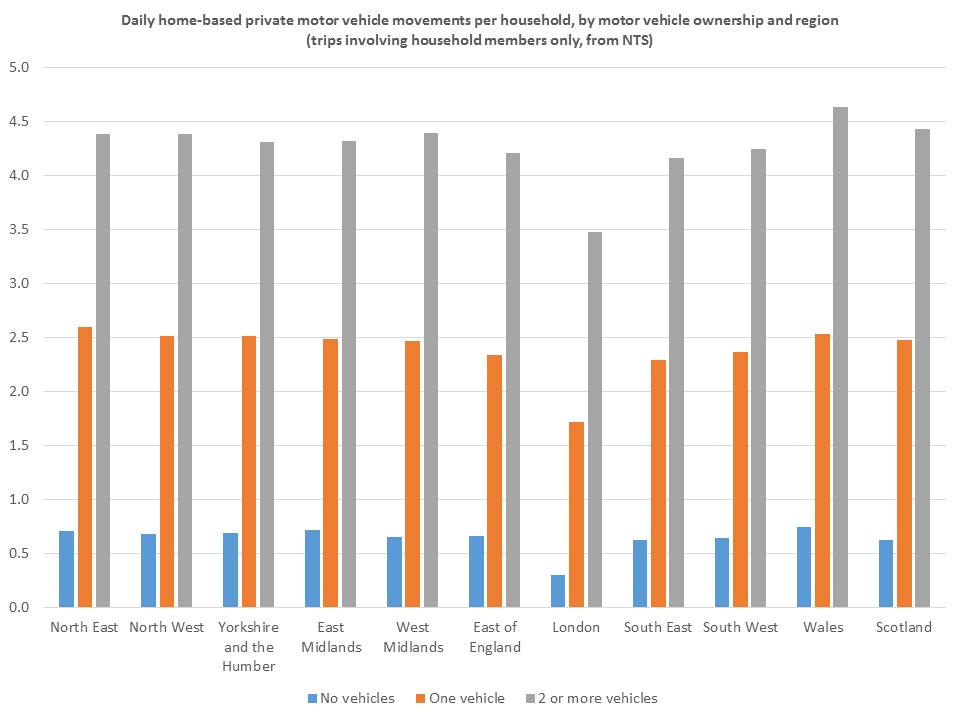
Motor vehicle movements generated per household, (i) only
Unsurprisingly, two-car households generate more local motor vehicle movements than one-car households, which generate more than no-car households. And there’s a noticeable ‘London effect’: at all levels of car ownership London households create fewer motor vehicle movements than other households. But even people in no-car households across the country do make some trips involving motor vehicle movements: this might be taxi trips, or demand responsive transport (e.g. community buses), but could also mean adults or children getting lifts from friends or family. For instance, a divorced parent coming to pick up the kids, or a neighbour giving you a lift to work.
This data can then be used to look at individual streets: of which more later. For example, with the aid of Census data on car ownership rates, I calculated that each household in my own ward would generate 0.97 local motor vehicle movements per day, from their own trips.
However, that’s only trips involving the people living in the household. What about (ii) and (iii)?
Visiting friends and family accounts for 15% of all trips made, so I’ve made the assumption that for every 100 motor vehicle movements made by residents, another 15 movements will be generated by people visiting them.
I was unable to source figures for the frequency at which people call out tradespeople like plumbers: so I’ve guesstimated a motorised service visit once a month per household, on average. I’m assuming each such visit involves two motor vehicle movements (arriving, and then later on, leaving). On average 0.08 motor vehicle movements per household per day.
What about the home delivery trips (iii)?
Initially I drew a blank in estimating home delivery trips per household. However, TfL has been doing some research, partly to create an evidence base for reducing the impact of delivery traffic. London households have on average 81 home deliveries per year, which assuming no Sunday or bank holiday deliveries is around 0.27 deliveries per day. Unlike the plumber visits, I’m counting each as only one motor vehicle movement, which I think is reasonable as many will drop off and continue. In some cases drivers will drop off at several houses at once – although sometimes multiple visits may be made to secure a delivery, counteracting that.
From other figures cited in the TfL research (“Investigation of home delivery via central locations”) it looks like home deliveries outside London are lower. Londoners with all levels of car ownership tend to drive less than those living elsewhere; it makes sense for there to be a trade-off between personal driving and deliveries. I’ve assumed that outside London, the rate of household deliveries per day is around half the London figure, say 0.14.
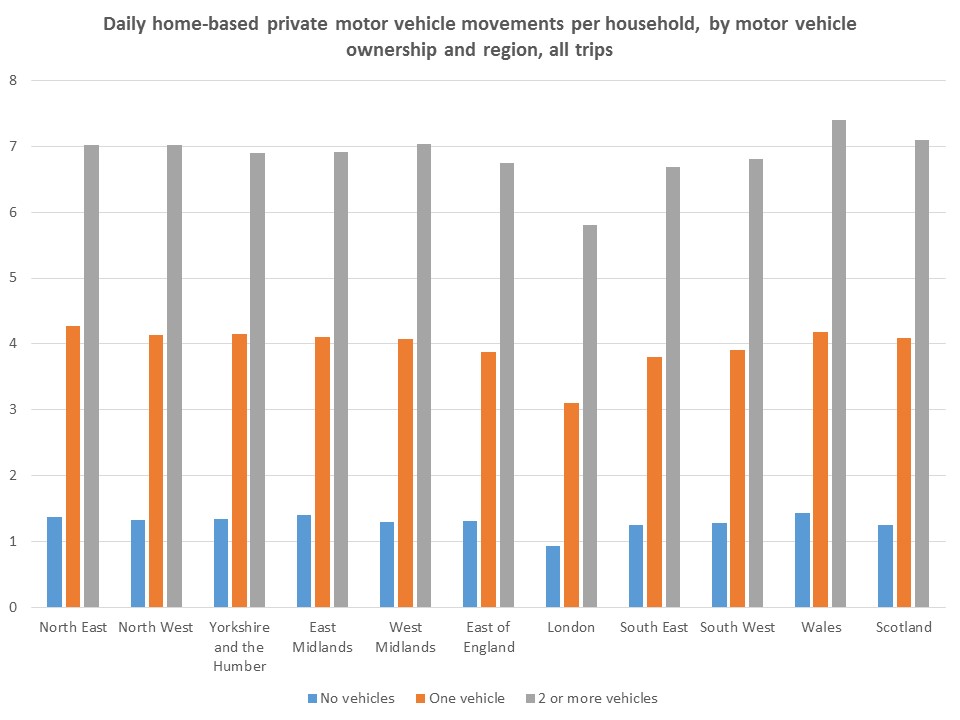
Motor vehicle movements generated per household, all
In my ward, adding up all three trip generators gives an average of 1.47 motor vehicle movements per household, per day. But, to be fair, in estimating local motor traffic along a residential street, we should increase that figure to account for people living just off the street in question. Even if every driver takes the shortest route to the nearest A-road (i.e. avoiding rat-running), some will still have to use other residential streets to get to that A-road.
The extent of this will vary in different streets, but I decided to multiply up by a third. With more time, resources and expertise this could be modelled – it’ll vary – but from a look at different street patterns, a third seemed a reasonable rule of thumb to use by now.
Adding that in, for my street, we get an average of 1.95 motor vehicle movements generated per household, per day. With around 160 houses and flats (assuming similar numbers of households), we’d get to 313 motor vehicle movements daily; including resident trips, visitors, and deliveries, for those of us living on the street and adjacent to it. It’s probably not that far from what we actually have – we have virtually no rat-running due to traffic management schemes (roads closed to through motor traffic, and opposed one-way streets) in the area.
How did I generate the figures for my road? Firstly, I looked up the figures on car ownership by household, from Neighbourhood Statistics. I then multiplied up by the region- and car-ownership specific figures in the second graph. Then I produced an average vehicle movement per household figure.
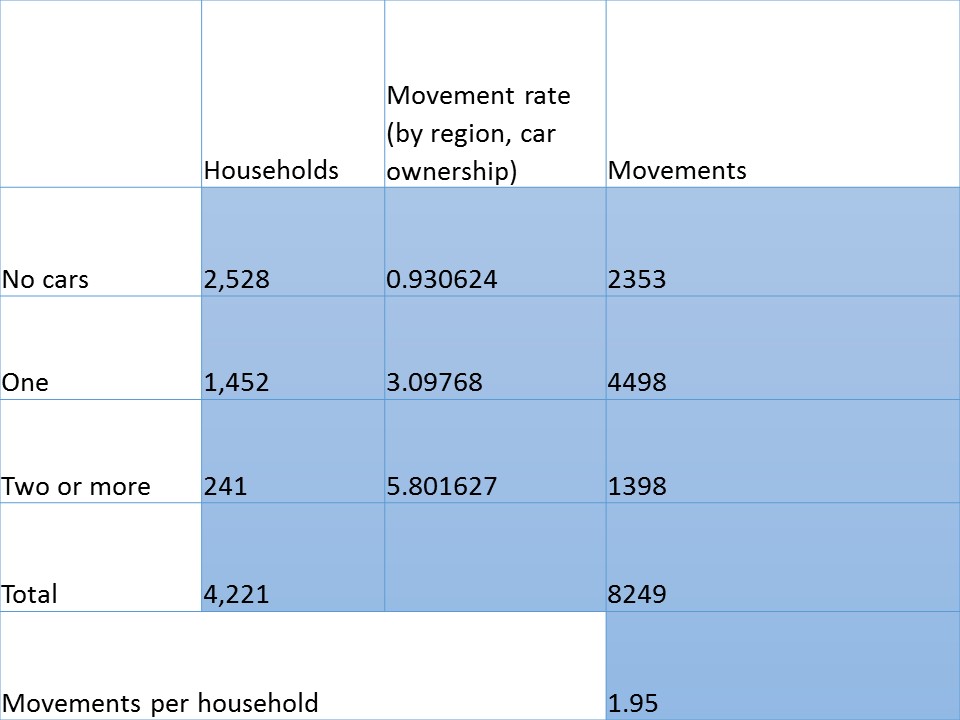
Local motor vehicle trips in my ward, on a per-household basis, to use for per-street calculations
Hence, around 300 motor vehicle movements might be expected in my street of 160 households.
That’s one street in one ward in Hackney, but what about other wards and boroughs, other parts of the country? One problem in generating (and analysing, and mapping) this data on a large scale is that we don’t have open address data in the UK. Still, one can make initial estimates, and I’ve done this for Hackney, Waltham Forest and Derby, based on figures I’ve been able to source on the number of named streets in each. One thing that’s quite interesting is the trade-off between car ownership and population density. In Derby, car ownership and vehicle movement rates are much higher than in Hackney or Waltham Forest. However, Derby has lower population density so there are significantly fewer households in each road. This means that in the three local authorities, the average number of motor vehicle movements per street is in the same ballpark – the low hundreds.
This post is getting long enough already, so I’ll stop there. In the next one I’ll put up tables for the three boroughs and the spreadsheet by region and car ownership levels, once I’ve tidied it up.
Remembered that I had offered to upload the spreadsheet. Having gone through the calculations again to double check my working, here it is – the ‘final_figures’ worksheet is the one to use. I would suggest that if looking at a few streets or a neighbourhood, use the top set of figures, while for examining one road (as I do above for my street), use the bottom set with 1/3 added. The estimates are slightly lower than those given above – I realised I had previously omitted to add back in households that made no motor vehicle trips themselves in a week, hence the figures above are a bit higher than they should be. (It doesn’t make as much difference as you’d think, as those households are still assumed to get car-borne visitors and deliveries).
Download the file: Local_motor_traffic_volumes
This is an interesting approach. I’m currently doing measurements of rat-runners along my West London street so will look at your approach to see if I can get an estimate of the number of trips made by residents. I suspect it will be a very low percentage…
One thing that might need to be considered is the presence of car club vehicles on the street. The service providers like Zipcar may be able to provide data regarding their use. A car club vehicle may not be just used by no-car households but anecdotally, I’m aware of them being a factor for households to downsize from two-car to one-car with the car club providing the “second” car.
You have a interesting approach going on, but really there’s a fundamental flaw.
With regards to your estimations on number of movements per household per day, you have come up with an odd number (roughly 1). Logic tells you that an average journey from a place of residence will mostly be a return journey, so I believe you are largely underestimating the movements of residents.
This will then skew your analysis to show a greater proportion of so called “rat-runners” (I hate that term…) than the real number.
Hi Tom,
Thanks for your comment. I think you’re referring to my estimated .97 personal motorised home-based vehicle movements (bit of a mouthful, sorry!) per household, per day in my own ward, as indicating a problem with the calculation? This is an average across households and days – so it could work out as an odd number, even though most trips as you note are return journeys. It doesn’t mean people in the ward are driving to work and not coming home, rather that, for instance, some households are making a return car trip (e.g. home-work-home), while some are making none. Say five households make a return trip from their house on a given day, and five others don’t – that makes an average (mean) of one movement each across the ten households. (There’ll also be variation day-by-day within households). So I don’t think getting an odd number implies an error. I’m using the average (mean) to generate an estimate of movements in a street, but – as with average cycle trips per person – the mean doesn’t necessarily equate to what an individual/household typically does.
best wishes
Rachel
In that case, you can’t group them into a single model.
Zero-car households need to be analysed apart as they will muck up your modelling technique described above.
Is it not possible to use live data now from mobile phones, as Google does for congestion?
And to be honest I cannot see any problem with just preventing rat running by judicious area wide woonerfen, and detailing precisely what happens somewhere and then judiciously managing it with a full set of interventions, as the Waltham Forst experience is showing.
Do you happen to have a link to the TfL research you mentioned regarding home deliveries (Investigation of home delivery via central locations). I couldn’t find it via their website/google. Thanks!
Ah sorry Geoff, I was sent it directly on request, and I don’t know if it’s publically available (fear not – although it’s very interesting and not particularly controversial).
Have you still got the data for the movement rate (by region, car ownership) that informed your charts? I’ve struggled to get the figures from the NTS without much luck for the South West to replicate your exercise for Bournemouth.
Hi there, can you drop me a quick email (r.aldred@westminster.ac.uk)? I can look it out for you and send over.