

This week I attended the meeting of a steering group at which I represent LCC. I updated the group on the motions passed at the LCC conference last weekend, specifically Motions 3, 4 and 5, which were relevant to the topics under discussion. It struck me that it might be worth writing a bit about how Motion 3 in particular (as this was the one I proposed) might be used in local campaigning. I was also asked this question at a meeting of Camden Cycling Campaign recently, who are seeking to use the policy to support a local campaign to get the Outer Circle closed to through motor traffic.

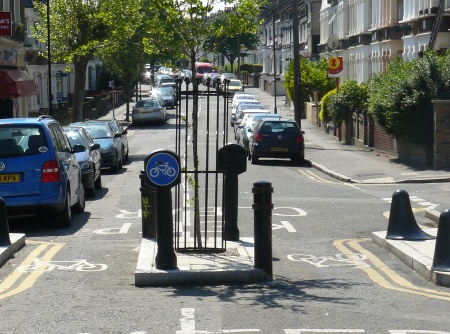
New Cavendish Street. No protected space. At peak, busy; off-peak, fast. Either way, unpleasant. On the ‘Cycle Network’ and on my route to work.
We discussed benchmarks at several Policy Forum meetings and by email. The benchmark chosen for speed is 20mph. This should be actual measured speed at the 85th percentile (a commonly used measure – meaning that 85% of motor vehicles should be going at 20mph or less). Making it an actual speed makes it clear that putting in 20mph limits isn’t enough, if these are ignored by drivers.
The benchmark chosen for volume is 2,000 PCU (Passenger Car Units – a size-based measure) per day. According to TfL figures, a car or taxi counts for one PCU, a motorcycle 0.5PCU, a bus 2 PCU, and an HGV 2.3 PCU. I think this metric is too low for motorcycles and HGVs; HGVs in particular create massively elevated risks for cyclists. I’m pushing TfL to be a leader here (ahead of the Dutch!) and start using a risk-based metric; until then, I suggested LCC sticks with PCUs but raises additional concerns where HGV volumes are high.
These definitions aren’t that ambitious, if we’re really aiming for mass cycling – everyone, including the little kids riding along with their Mum, the disabled couple on adapted bikes, the wobbly teenagers coming home from the pub, my colleagues at work who hate the Tube but refuse to ride on New Cavendish Street… Of course, many of us who cycle now experience motor traffic volumes and speeds far in excess of this, even on the ‘cycle network’. In Westminster, there’s a stretch of Sussex Gardens not far from my work, which I use if I need to get to Paddington. It’s signed and on the London Cycle Network. It’s nine times over the 2,000-PCU limit – and feels it.
So simple, so effective: a Hackney street closed to through motor traffic, but open to people on bicycles and on foot.
So, faced with a potentially problematic scheme proposal – such as a ‘Quietway’ that isn’t Quiet – how do you use the ‘20mph – 2,000PCU test’? Obviously, we need to know what current volumes and speeds are. If either of these fail the 20mph-2,000PCU test then – assuming cyclists are not given protected space – there must be clear measures proposed to ensure that volumes and/or speeds will be reduced to acceptable levels.
Scheme proposers should say what the current speeds and volumes are: they sometimes do, but not always. If not, you have several options. If it’s a major road, there may be volume counts available online at the DfT website. Go to the borough page and then to the ‘interactive map’. Counts are presented as AADF, ‘Average Annual Daily Flow’, (this useful document from the DfT provides more detail on methodology) so you immediately have a daily figure for different modes. You can calculate the daily PCU flow using the multipliers above, and see if it’s over 2,000.
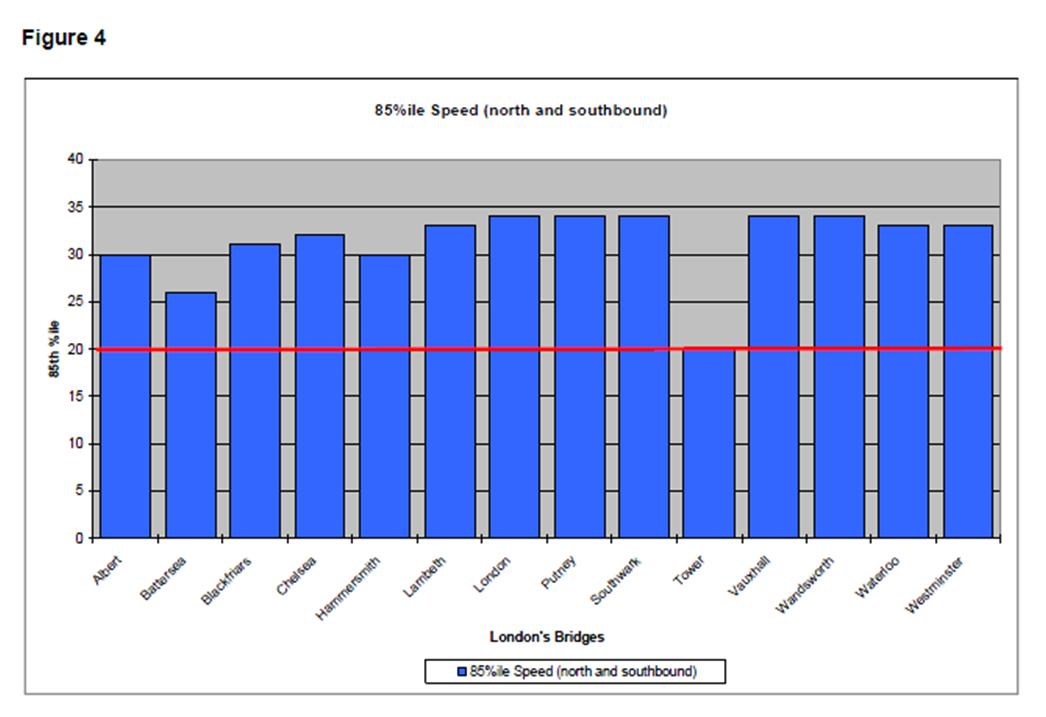
Table 4 from the report, on 85th percentile speeds on London’s Bridges.
If there’s no data provided, or available online, you can ask a sympathetic borough officer to provide speed and volume figures: in many cases, these are monitored by TfL and/or boroughs, but figures are not routinely made publicly available. You could make a more formal request, asking for it to be treated as an FOI, if need be.
Or – and if you have time, it might be worth doing this too – you can do your own volume counts to give a rough initial estimate. Half an hour counting the four main types of motor vehicle (car/taxi, bus, HGV, motorbike) at peak time will give you an estimate that you can convert to a daily flow. Transport for London provides conversion factors in a document called Traffic Note 2: Expansion factors for road traffic counts in London which I’m trying to locate and share – although this is only for TLRN main roads. But in the meantime, you could multiply a half hour peak PCU count by 20 to give a rough index of daily flow, and how close or far from 2,000 it’s likely to be.
Monitoring speed’s a little harder, but groups might consider investing in a speed gun, which can be a useful campaigning aid. Pocket sized devices now exist and have been used by 20s Plenty groups. You could use it to record the speed of motor vehicles when traffic is free-flowing, and then calculate the 85th percentile. If you record the speed of 100 vehicles it’s easy. All you’d have to do is put them in a table, order them by size, and pick the 85th. (Or, follow the steps here.)
So hopefully, you have some figures both for 85th percentile speeds, and for annual daily flows. What happens if one or both are too high? You can see whether there are changes planned that are likely to reduce the figures to acceptable levels; for example, in terms of speed, this might be a speed limit alongside streetscape changes and plans for enforcement. For motor vehicle volume, it might be plans for modal filtering; closing the road to through motor traffic, which is likely to reduce flows to under 2,000 PCU. But if clear and convincing plans are not in place to meet or better the 20mph-2,000 PCU threshold, I recommend objecting on these grounds.
You might even want to object where a scheme is in line with the threshold, in some cases. This might be in terms of likely cycle use (e.g. where a scheme’s on a route to a school), or motor traffic composition (e.g. where there are more than a small number of HGVs, which pose such a high risk to cyclists). While 20mph-2,000 PCU is ambitious compared with what cycling in London is currently like, it’s not that ambitious if we’re expecting mass cycling among children, or to ensure that no more cyclists are killed by HGVs.
The nice thing about 20mph-2,000PCU is that it allows campaigners to be flexible about solutions. The right answer, depending on context, could be blocking through motor traffic, creating a cycle-only street, or building a segregated track. All can achieve the core aim: of ensuring that people cycling can do so in a comfortable and safe environment.
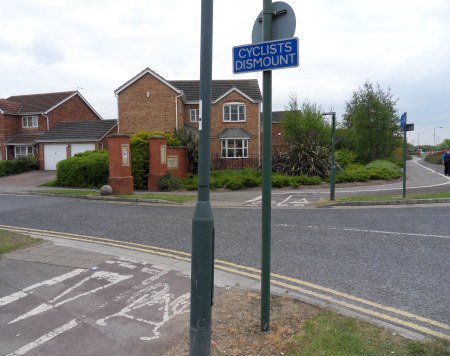
No, nothing like this, please.
Just a quick point – most people I come across think that AADF, ‘Average Annual Daily Flow’ DfT counts are unreliable. Particularly true for cycling, but also other modes.
Of course DfT counts are somewhat unreliable – sometimes that’s obvious from just looking at the numbers – but are they bad enough for that to matter? All statistics are somewhat unreliable, as I imagine sociologists know well. If you want to lower your confidence still further, read Abu-Talib’s tirade about the central limit theorem, in his Black Swans book.
The various flakinesses are probably similar from counter to counter, and even more similar for the same counter from year to year. If we are looking for a count of 2000 ADT, who cares if it’s actually 1800 or 2200.
I live on a road with counters. The published counts seem broadly consistent with what used to be the standard LCC way of counting, a 3 hour count in the am rush hour, which I do every couple of years or so, by staring out of my kitchen window
Pingback: What Leicester City Council and Sainsbury’s could have done (2) | 42 Bikes
Pingback: improving Oxford cycling - Oxford Blog
Pingback: Camden's West End Project - Look Around The Corner | Amble Scope
PCUs are pseudoscience. Not even the traffic engineers can agree on how they are to be used: https://comparativegeometrics.wordpress.com/2015/03/16/pcu-factors-are-they-just-pseudoscience/
TFL imagines that a bus is equivalent to two cars. Utter nonsense – they have a vested interest in making buses look good, so using a factor of 2 makes their models support large numbers of buses. Cycles have a PCU of 0.2, which again is quite imaginative. A better measure is ‘productivity’ – basically the number of persons transported. When calculated with a realistic PCU for a bus of about 8, the figures are vastly more informative.