

Based on a soon-to-be-published Journal of Transport and Health paper: to follow. [Now available – free link here will work till Feb 12th]
There are various problems with transport appraisal when it comes to walking and cycling schemes. Our scheme appraisal systems developed in the age of the car, hence their metrics focus on delivering benefits for motorists – particularly ‘time savings’ benefits. This has created a two-fold problem for walking and cycling. Firstly, because these modes have generally been ignored or marginalised within modelling and appraisal: in the UK, most area-wide transport models still simply treat active travel as a residual (i.e. what’s left over after motorised trips have been calculated and allocated to routes).
And secondly, because the focus on benefits for existing users ignores the main aim for many active travel schemes: attracting new usage. The Department for Transport’s health economic benefits calculator (part of Active Mode Appraisal guidance) relies on users inputting the amount of new walking and cycling, as does the World Health Organisation’s similar HEAT tool.
Yet we struggle to predict and to measure the effect of schemes on walking and cycling. Mostly, what’s used for prediction (sanctioned by transport appraisal guidance) is a ‘case study’ approach. People look at examples that we have data for, which they think might lie in the same ballpark (not very scientific, and limited by the ambition and success of what we’ve done before) and then say ‘well maybe this scheme might have a similar impact’.
Things aren’t always much better when it comes to measuring new usage from actually built schemes. Transport authorities do often collect pre- and post- counts for walking and cycling, even for small schemes. But on their own, counts don’t tell us about new usage. A post-scheme increase in foot or cycle counts could come from:
- Mode shift (often we would like this to come from the car, but it could come from other modes)
- Completely new trips (e.g. people walking more around their local area, some of which might be more for leisure than travel; from a health perspective it’s all good)
- People diverting an existing walking or cycling trip to take advantage of improvements made. This could mean a longer trip – if people detour to walk down a newly improved street; but might conversely mean a shorter trip – if people had previously been avoiding the now-improved street, and now feel able to take a more direct route.
- People changing a trip destination to take advantage of the improved conditions: for instance, cycling to a different market, grocery shop or supermarket to do the food shopping, because it is now served by a better route than their previous destination. As with (3) this could lead to an increase or decrease in trip distance.
Clearly, (3) and (4) are good things. They are a vote of confidence in the scheme – people are changing where they go in order to benefit from increased ‘journey ambience’ (as appraisal calls it) – and result in people having more choice about where to go. However, they do not necessarily result in any more walking or cycling: the journeys made are not new and distances may go up or down. To measure the additional amounts of walking or cycling (which is what leads to health benefits), we need to separate (1) and (2) from (3) and (4).
However, we can’t do this on count data alone, which by including (1)-(4) will overestimate the amount of new walking and cycling. One study of a scheme in Copenhagen found that most newly counted commuters were existing users diverting (3). This doesn’t mean the infrastructure was a failure – as well as some mode shift, the study found a substantial increase in existing user satisfaction, relative to the control site. But relying on count data alone would not have allowed the researchers to identify the level of new usage.
This is especially a problem in relation to smaller schemes, for which there is less research and where we know less about likely impacts. For large schemes and programmes – like TfL’s mini-Holland programme – we should be investing in ‘gold standard’ methods, such as ‘natural experiments’ comparing change over time among an ‘intervention group’ with change among a ‘control group’. But these methods are expensive. Even cut to the bone they cost £100,000+, and often much more. Getting a decent sample in these days of survey fatigue can be particularly difficult and resource-hungry, for instance, but is crucial for our ability to detect change.
If it’s hard enough to get many transport authorities (thank you TfL!) or research funders to invest in high-cost evaluations for major schemes, it’s well-nigh impossible to expect them to pay out large amounts of money to evaluate schemes where the intervention itself costs a fraction of the cost of a longitudinal study. Hence, my interest in doing ‘good-enough’ evaluation, which could dovetail with what authorities are already doing, and build up an evidence base allowing us to generalise on – for instance – the impacts of different ‘healthy streets’ type indicators. If we build up a dataset of results from different contexts (e.g. a historical riverside street versus a postwar housing estate; an area with high walkability versus a more suburban location; somewhere with lots of cycling versus somewhere with very little, etc..) we can hope to recommend different interventions or packages of change in different contexts.
If we remove most motor traffic from a street, are we likely to see new walking trips? What about if we put in a pocket park, or replace some car parking with cycle parking or with benches? Which interventions are really crucial to getting more local trips made by active modes? And which are nice-to-haves, but possibly not the first thing you’d do if you had limited funding, or if they might prove difficult to agree?
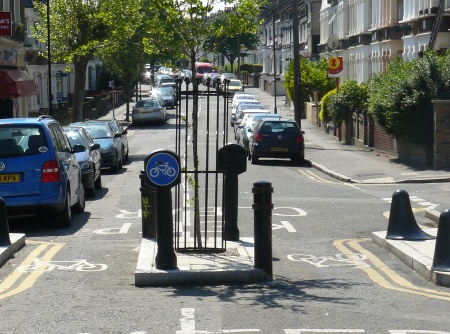
Modal filter, Hackney
If we can measure walking and cycling uplift in relation to smaller-scale interventions, we can start to develop estimates of health benefit, and to look at these in relation to costs of implementing interventions, and potentially other quantified costs and benefits. Given £100,000 in a given context, what streetscape changes might have most effect?
The good news is that there are ways we can start to develop this evidence base. I’ve got a paper accepted in Journal of Transport and Health, which will be out soon and proposes a method. Basically, it involves using pre- and post-count data (often routinely collected) alongside a low-cost intercept survey to estimate what % of walkers and cyclists who have changed behaviour are ‘really’ new (1 or 2 above). This % is then used alongside the change in count data to estimate how many new walk and cycle trips have been generated by a scheme, and hence calculate health economic benefits (using the WebTAG Active Mode Appraisal Health Economic Benefits spreadsheet tool). Doing an intercept survey also means you can collect some useful perceptions and qualitative data at the same time, as well as look at where mode shift is coming from – which has implications for e.g. changes in emissions.
In the case study example, an intervention with physical measures costing under £10,000 was associated with in the region of £500,000 of health economic benefits, calculated using a standard twenty-year appraisal period.
It’s not gold standard data, but for low cost interventions, I think it is appropriate – and much better than only collecting count data. And if we do this in a standardised way across a number of smaller schemes, with careful records of what was done where and in what context, we could scale-up: analyse the aggregated data and use the results to adopt a more scientific approach to appraising and hence prioritising streetscape interventions, in terms of their impact on walking and cycling. The case study I’ve done relates to a specific street context and results elsewhere may be different; with tens of similar studies we could start to tease out the impacts of (for instance) modal filtering in different types of location, with different existing travel patterns.