

Note (5th March) – the survey has now closed and I’m analysing the data. Thanks very much to all who filled in and/or shared the survey link. Updates to follow.
This post discusses why I’ve set up this pilot project, and what I hope to achieve.
So I finished the big grant application (on which note, thanks so much to all the colleagues who provided feedback. I really appreciate you taking the time to help – with a 13% success rate please don’t be too disappointed for me if I don’t get it…) This means I have some time to return to the unfunded and pilot research projects I’d left hanging.
One of which is on injury risk. There is a paradox in road injury research that there’s an awful lot of work, often very detailed, looking at the characteristics of sites where pedestrians or cyclists are injured – but we still often know very little about risk. We might know that there are a lot of pedestrian or cyclist injuries at a particular location. But how does the risk per pedestrian or per cyclist differ from other parts of the street network? We don’t know, without being able to normalise by pedestrian or cyclist numbers. And we often can’t do that – not consistently across the network – because we don’t count people anywhere near so well as we count motor vehicles.
On one hand you might say that not knowing about risk doesn’t matter. Don’t we just want to look at where injuries happen, and intervene where there are lots of injuries?
Maybe not. Firstly, in most settings that have been studied, the health benefits of active travel (walking or cycling) on a population level substantially outweigh the health burdens active travellers experience from injury risk and air pollution. This is true in the UK, even with both of the latter higher than they should be – and active travel modes pose little risk to others. So we could actually harm health, if we focus on places where lots of people are crossing the road or cycling, and put in poor measures that deter walking or cycling (not that we’d know, if we don’t count people on foot or on bikes).
For instance, putting in guard railing to stop ‘jaywalking’ might mean people don’t bother walking because it becomes too inconvenient to get across a busy road. So injuries may fall, but largely because walking has fallen – meaning people get less exercise, and an overall health harm. Injury risk for each remaining pedestrian may even grow, as more people drive instead. (This is the story of post-war road safety: see work by writers such as Bob Davis, Ian Roberts, and Mayer Hillman, on that).
But let’s assume we’re better than that; that ‘cyclists dismount’ signs and guard rails are no longer part of our toolbox. (And to be fair in London, we’ve seen a shift away from both). Then surely focusing on places where injuries happen, and doing good stuff to prevent them, is the obvious thing to do?
Well maybe, maybe not. Firstly there’s an equity argument. Looking at London boroughs (paper out soon) I found that the worst have up to seven times higher per-km cycling injury odds, compared to the safest boroughs. Is it fair that someone who cycles two miles to the shops in Redbridge, say, has much higher risk of being injured than someone cycling the same distance in Camden or Hackney? Particularly given the person in Redbridge may well have fewer other options, e.g. public transport will probably be sparser.
Secondly, it’s not awfully convincing to say, ok, it may be scarier than it should be to walk or cycle in your area, and this may be putting people off, but if some more people start walking or cycling, meaning we get more injuries, we’ll then make it safer. It’s unlikely to persuade your average parent to let their child walk or cycle to school. There are reasons why people find cycling scary in much of the UK: it’s to do with intimidating road environments, lack of good infrastructure, and poor driver behaviour. A lack of recorded injuries don’t make a nasty A-road any more appealing.
Which leads onto the third point. Injury numbers are a poor measure of danger. If injury numbers go up, is that always a sign something is wrong? Or put another way: has an authority done poorly, if over ten years the number of people cycling doubled, but cycling injuries rose by 10%? Probably not. Each cyclist’s risk of being injured would be 45% lower; a pretty substantial decline.
But what if cycling doubled, and so did cycling injuries? In that case, if I were the transport authority, I would be concerned. On the one hand, there should be an overall health benefit, because the physical activity benefits from the extra cycling ought to outweigh risks due to road danger and air pollution. But no (or little) change in injury risk is worrying because (i) in general highly motorised societies see reductions in road injury risk – i.e. decline is to be expected as a ‘normal’ pattern and (ii) ‘safety in numbers’ would suggest that per-cyclist risk should fall if cycling numbers grow substantially. So to see no change in injuries per cyclist, while cycling grows substantially, would be worrying and to me suggest not enough is being done infrastructure and policy-wise to support and safeguard people cycling. (See paper for more on this issue).
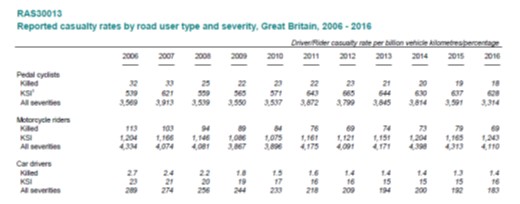
Section of DfT rate-based table, from 2016 annual road casualties report.
As is increasingly being recognised, we need to monitor per-kilometre, per-hour, or per-trip injury rates, if we want to reduce danger for people walking and cycling. This is already done by DfT at a national level, although mainly for cyclists and motorists. However, at a local level, most authorities still just look at absolute numbers. This may be changing. At the end of last year, Greater Manchester made a pledge to monitor and reduce rate-based casualties for walking and cycling. Two years previously, Hackney in East London had promised to monitor rate-based cycling casualties, although I’m not sure what’s happening with that.
Such metrics are also crucial for investigating the impact of infrastructure, road characteristics, and policy (e.g. 20mph zones) on road injury risk. While many studies include such factors, if they don’t control for the amount of walking or cycling, they don’t tell us much.
Controlling for the amount of walking or cycling, as I mentioned above, is often difficult given data limitations. (My forthcoming paper discusses some of the problems, before using a ‘case-control’ approach involving use of modelled cycle flow data alongside routine injury data). One promising approach, used by Professor Kay Teschke in Canada, is a ‘case-crossover’ design. This means you compare characteristics of sites where people were injured, to characteristics of ‘control’ sites selected randomly from the route they followed prior to injury. From this you can identify the types of location associated with elevated injury risk. Professor Teschke’s most startling finding was that riding on cycle tracks was associated with a ninth the injury odds of riding on a busy road with car parking.
I like the case-crossover design. It’s elegant and controls for behavioural confounders (such as the possibility that cyclists with higher levels of skill might differentially use certain types of infrastructure, for example), because individuals act as their own controls. On the other hand it can be expensive. Professor Teschke’s team interviewed injured people, getting them to draw the route they followed prior to injury. They visited every injury and control site to record route characteristics.
I think technology could help with both those problems. Instead of in-person interviews, many people would be able to use a web app to tell researchers about their route. Open geographical data, Google Street View and other services make it easier for researchers to identify site characteristics without visiting in person.
But beyond that, I think we could go further. What if, knowing start and end points (i.e. where a person started their journey, and where they were injured), we could reasonably well predict their route using a journey planning algorithm? If this worked, just imagine how it could transform risk research. If we added a question to Stats19 (the form police use to collect injury data) about where trips ending in injury started, we would open up a whole new world of risk-based analysis.
Statistical power would be much higher. The confidence intervals for Professor Teschke’s findings were often large, as she was limited by the number of injured people she could feasibly recruit and interview for her project. Imagine if we could effectively recruit thousands of people every year, just by police asking a standard question about route starting point. (Perhaps we could substitute it for the not-very-useful ‘journey purpose’ question).
Of course, you wouldn’t want to add trip start location to the public dataset. What government could do, to make maximum use of this valuable data, would be first to route those trips via journey planning algorithms. From the resultant routes, they’d randomly select control sites as per Teschke (I’ve done similar using QGIS for the forthcoming paper on injury risk in London) then add those locations to the public Stats19 dataset.
Then anyone who downloaded Stats19 would get not just where people were injured, but also the location of a corresponding control site or sites from their route, where they were not injured. All of those control sites, for the whole country, would basically give you an map of where pedestrians and cyclists might have been injured, if all of their routes were equally risky. And researchers and authorities across the country could carry out multiple comparisons between the injury and control datasets, including looking at how infrastructural risk factors are mediated by gender and age, for example.
That’s my data dream. So what of the pilot project? I’ve commissioned a web app which allows people to record routes. And I’m looking for people who were injured in the past six months, while walking or cycling, either on or off road, and who can remember the route they took prior to injury. The injury could be extremely minor, and doesn’t have to have been reported to police or to have involved any medical treatment.
The aim is to test how well collecting route data via a web app works, and to do some comparisons between reported routes and routes generated by algorithms based on start and end points. If I get enough participants, I may be able to do some substantive analysis (i.e. look at factors associated with injury risk). Could you help? If so, please click here to find out more and fill in the online survey.
I filled in what I could but the survey ended abruptly when the route choice window said “You can now close this window” – and I did!
If you can recover my data, it ended before I could enter my email to register interest in your study results.
(The Google map at the start was also behaving oddly – resizing to full window when I clicked to pan)
Sorry Michael – yes I will be able to recover it and happy to keep in touch with the results. Apologies. (It should come up as a pop-up but I think is not doing so on all browsers).